
Are you still relying on guesswork and outdated methods for predicting crop yields and managing water resources? The AquaCrop plant simulation model offers a data-driven approach for optimizing agricultural practices.
Predicting crop yield in different climate situations and farm management is an important aim for future scheduling and economical farming. Using crop growth models is one of the common tools for this prediction. One of the best ways to quantify the effect of climate change on crop production is to use crop growth models to predict the harvestable yield of different crops in climate change. On the other hand, precise crop yield prediction can be used for annual economic planning in farms. Crop yield prediction used to be experimental data according to the past available local data, but today the plant-growing simulation models provide trustworthy and valid crop yield data for economic planning. AquaCrop is one of the crop growth models developed by F.A.O. in 2009 and updated several times for better application.
Nowadays, many crop growth models exist. Each of these models, based on their scope and purposes, is appropriate. The AquaCrop Simulation Model , which is freely available, is a water-based model and user-friendly interface software for predicting crop yield and water use efficiency.
1. Crop Simulation Models
In every crop simulation calculation core, there are equations that estimate the biomass according to the growth involved parameters, such as carbon dioxide, water and solar radiation. All development models can be categorized in three types i) carbon dioxide-driven models ii) solar radiation-driven models and iii) water-driven models. In carbon dioxide-driven models, temperature, solar radiation and atmospheric carbon dioxide are estimated and, at the final stage, controlled by available water in the photosynthesis process to predict the crop yield. These models are complicated and need lots of data for running and calibration. WOFOST and CROPGRO are categorized in this type. Solar radiations base models predict crop yield by Radiation which uses efficiency (RUE) directly from solar radiations. These models are less complicated than type I which need less entry data. In these models, growth potential is a function of photosynthetically active radiation; the amount of absorbed radiation depends on leaf area index, row spacing, plant density, and the efficiency of radiation conversion to biomass. This model has the ability to quantify the main growth and development processes of crops, such as reproductive development and canopy cover development. Moreover, water-related processes, such as runoff, infiltration, drainage flow, etc. CERES models (CERES-Maize, CERES-Barley, CERES-Wheat, etc) are categorized in this type.
Water-based models predict the crop yield according to their evapotranspiration (ET) and normalizing water productivity (WP) index.
F.A.O. developed the AquaCrop plant simulation model by combining the existing data from plant phenological reactions as a tool for predicting crop yield due to available water supply.
2. AquaCrop Conceptual Model
Crop response to water deficit described by empirical production functions. Doorenbos and Kassam (1979) is a landmark mentioned in F.A.O. irrigation and drainage paper 33 to predict the yield response to water through the following
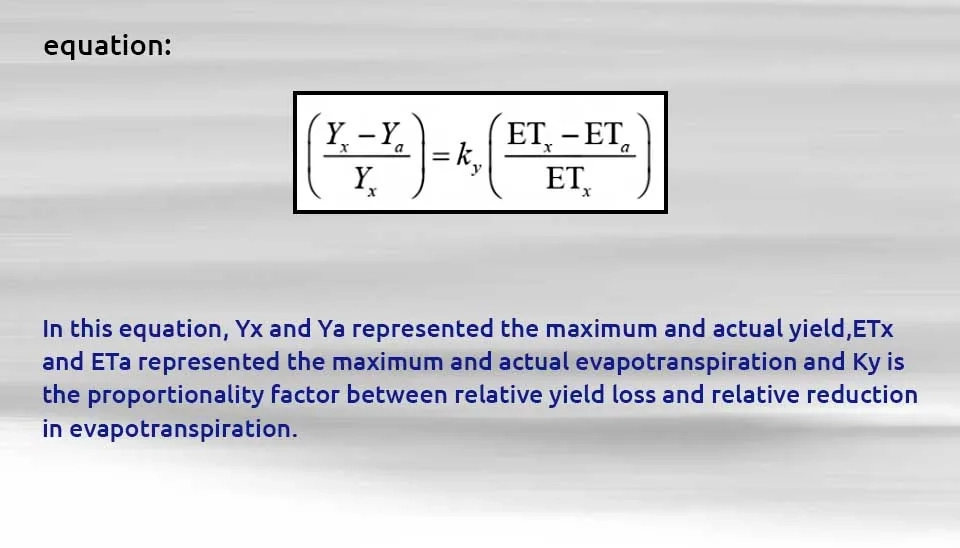
Conceptually, AquaCrop is a description of the Doorenbos and Kassam equation with some reformations. The crop evapotranspiration (ET) can be separated to soil evaporate (E) and crop transpiration (T) to omit the effect of non-productive use of water. This is so important, especially in the early days of growing when the canopy cover is uncompleted and soil evaporation may be the major component of ET.
Harvest index (HI) is the factor that AquaCrop crop yield prediction model uses for separating E and T in calculations. The harvestable yield is described as a function of biomass and HI to distinguish the environmental stress effect on biomass from what affected HI.
The core calculation of AquaCrop describes a function between crop transpiration and water productivity index as biomass ,then crop yield is estimated by biomass and harvest index simply.
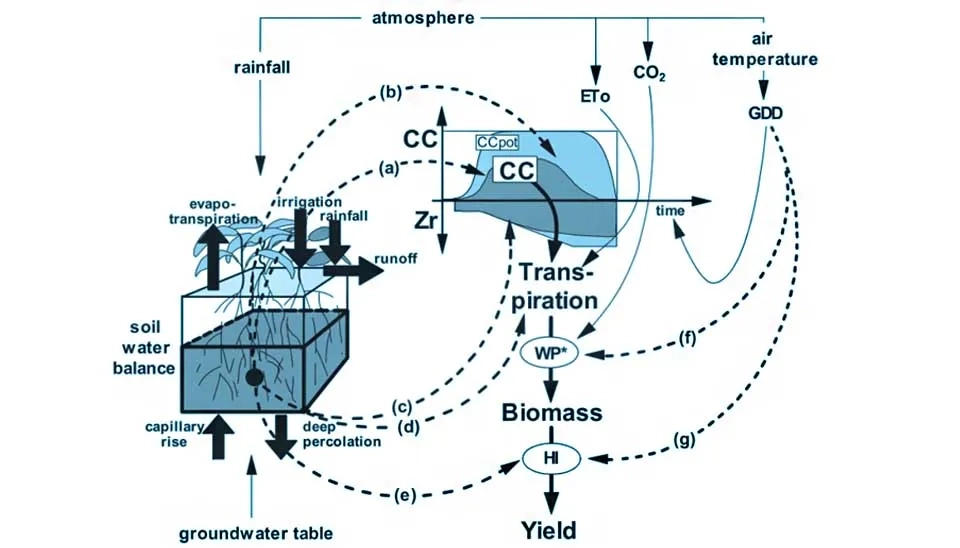
In AquaCrop, plant growth is described by developing canopy cover and accumulating biomass in daily time steps. The term of growing degree days (GDD) presents daily crop phenology over the season. Canopy cover (CC) development, transpiration, biomass production and yield are the terms of phenological simulation that are estimated in four steps.
1. Canopy Cover (CC): In AquaCrop, foliage development is expressed
through green canopy cover (CC) and instead of Leaf Area Index (LAI). The green canopy cover (CC) is the fraction of the soil surface covered by the canopy. It ranges from zero at sowing to a maximum value during the growing season, which can be reached to 100 in full canopy cover mode. Estimating soil water content in daily steps helps AquaCrop track the stresses in the root zone. Soil water stress can affect the leaf and canopy expansion in early canopy senescence.
2. Crop Transpiration (Tr): in well-watered conditions, Tr is a part of reference evapotranspiration (ETo) which is calculated by using crop coefficient (KcTr). The crop coefficient varies through the growing season.
3. Above-ground Biomass: this term is related to cumulative crop transpiration and biomass productivity (WP). WP factor normalized to cover the effect of climate change, diverse seasons and CO2 concentrations.
4. Crop yield (Y): the estimated above-ground biomass integrated all photosynthetic productions by crop during the season. Crop yield is the harvestable portion of biomass, which is extracted by using harvest index (HI). The actual HI is calculated by adjusting during the season.
Environmental stresses are described through stress coefficients in the AquaCrop plant growth model.
Fig. 2. presents the flowchart of yield calculations in AquaCrop. As it shows, soil-water balance is the start of the calculation process.
3. Input Requirement
The AquaCrop plant growth model uses a small number of explicit parameters and a large number of related input variables explicitly. Inputs consist of weather data, crop and soil characteristics, management practice and describing the environment in which the crop will be developed. The explanations for each of these inputs will be presented in continuation.
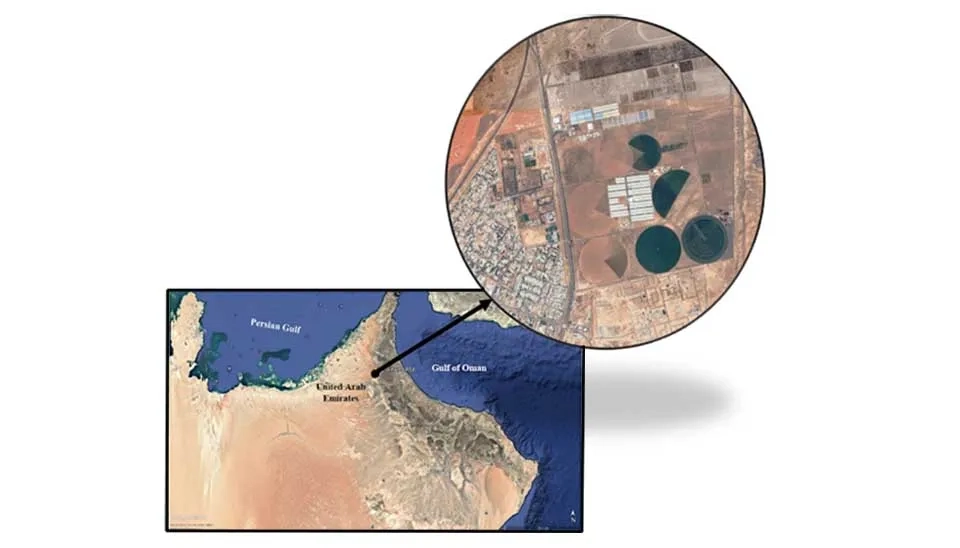
In this article, the wheat yield in a farm located 24° 21 '8" N and 55° 49' 37” E in the United Arab Emirates in Al-Ain State, which is the center of agriculture farms in the United Arab Emirates, is shown. This farm uses a center pivot sprinkler irrigation system for planting (Fig. 3). The United Arab Emirates is located in an arid climate and efficient annual rainfall is lower than 50 mm. Agricultural production is a minor part of the United Arab Emirates but the number of farms increased during the last 20 years. Agricultural land depends on available water resources and it is needed to optimize water productivity and maximise the crop yield with available water resources. Considering that irrigation water plays a significant role in final crop yield, water productivity as an important indicator shows the efficiency of all farm management practices, especially irrigation practices.
3.1. Climate Data
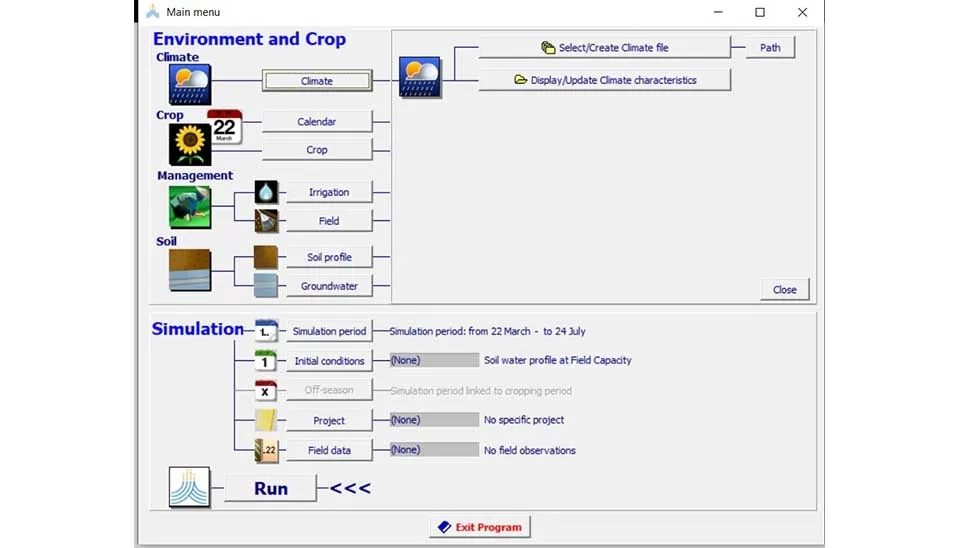
In the main window of the AquaCrop simulation model, there are some bottoms for data entry. The climate bottom leads you to a subwindow that lets you create new climate data, you can use an existing climate file or update it (Fig. 4).
Minimum climate data for the AquaCrop crop simulation model is minimum and maximum air temperature, references to evapotranspiration (ETo), rainfall (none) and CO2 concentration. ETo calculator is a useful joint software that helps you to calculate ETo with the F.A.O.-Penman-Monteith equation and import them to AquaCrop easily. You can use The ETo calculator training sample for more information.
The other way for climate data entry is to import the data from a text file manually. In this case, you have to create a text file (*.txt) from your climate data in order and without any headers and introduce the file to the AquaCrop plant productivity model . For each tab, you need to introduce the time range and units of your data (Fig. 5). Climate data time steps could be daily, 10 days, or monthly. You can define the value for the missing data. The default value of the model is -999. The upper and lower limit defaults of each data series should be adjusted due to your real data.
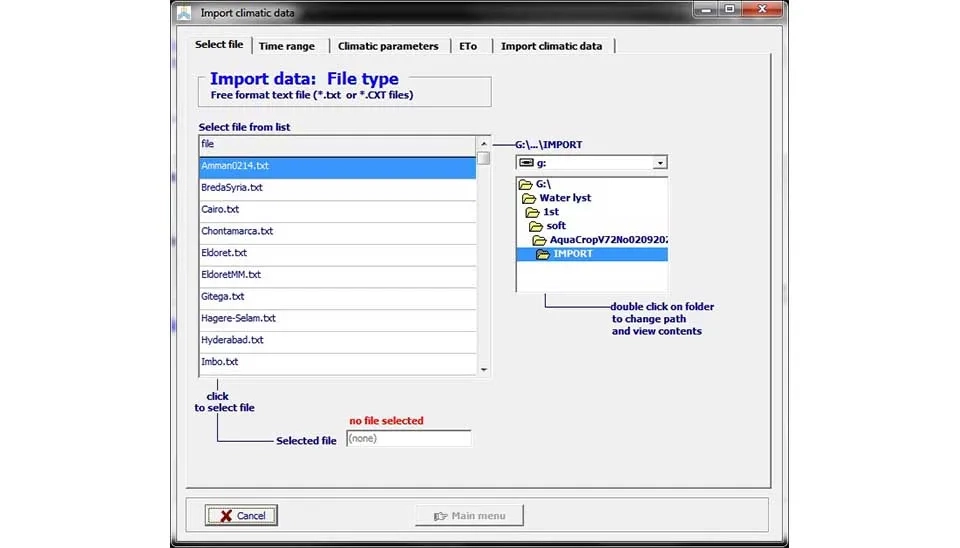
After completing data entry, you can create a climate file that can be updated in each model run.
In simulations with historical climatic data or for the near future, there is no need to create a CO2 file since the ‘IPCC-BERN_A1B.CO2’ file can be used. It contains the mean annual atmospheric CO2 concentration measured at Mauna Loa Observatory since 1958. The ‘GlobalAverage.CO2’ file, which was added in the newest version of AquaCrop, including the observed CO2 concentrations up to 2023, has been updated with the latest published results on the NOAA website.
For future simulation and assessment of the effect of climate change, a CO2 concentration should be created due to your climate change scenario. In this case, you can use the default file and paste the new value in it.
For Al Ain Farm, we use the data from the nearest weather station, including minimum and maximum temperature and rainfall daily data, in an ETo calculator and import the files to AquaCrop for creating new climate data. For CO2 concentration, the ‘GlobalAverage.CO2’ file has been used.
3.2. Crop Data
In crop data, two different bottoms will be noticed that both of them are related to the crop. The bottom of calendar data and the crop data bottom are related to the crop physiology data.
3.2.1 Calendar
In the calendar, you can use a specific day as the start of crop growth simulations, like the case of sowing dates or you can define a criteria related to rainfall or temperature parameters as the start point of crop growth simulations. It is essential to enter your crop data before creating a calendar file. For example, rainfall criteria could involve a minimum threshold of accumulated rainfall within a specific period, while temperature criteria might consider a consistent average temperature over several days suitable for crop germination. Use rainfall or temperature criteria mostly used for winter planting. In Al Ain Farm, the common time for wheat planting is from the middle of November to the middle of December. So the sewing date was the 4th of December. This selection ensures optimal soil moisture levels and temperature conditions necessary for wheat germination and early growth. Adhering to these parameters helps improve yield consistency and reduces the risk of weather-related planting failures.
3.2.2. Crop Characteristics Data
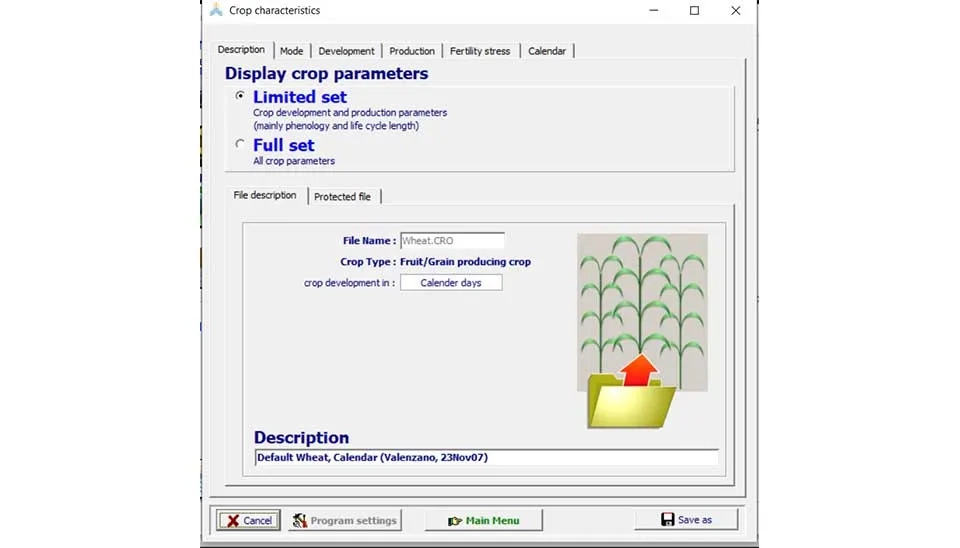
This bottom lets you enter the physiology data of your crop. In the AquaCrop plant growth model, more than 30 crop files exist. Each crop has two kinds of simple and GDD versions, which let you simulate a normal or off-season crop planting. These default files come from many calibration experiences and validated data around the world. Therefore, it is recommended using a default file and personalizing it for your farm or case study. Conservative crop parameters do not need to be tuned since they do not change much with time, management practices, geographic location, climate and cultivar. In Fig. 5, a crop characteristic window is presented. The default of software is limited set parameters that show only the cultivar-specific and non-conservative parameters that might require an adjustment when selecting a cultivar different from the one considered for crop calibration or when the environmental conditions differ from the conditions assumed at calibration.
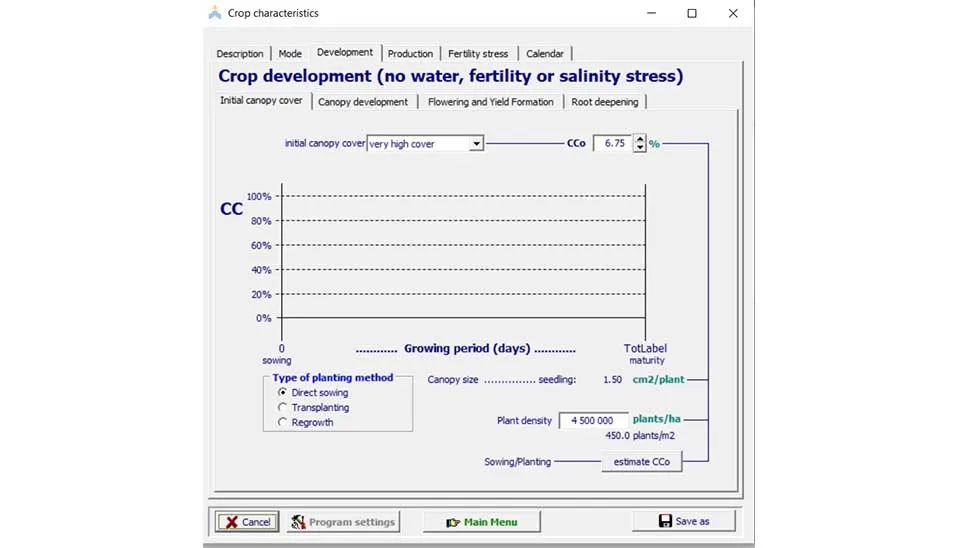
AquaCrop makes a distinction between direct sowing and transplanting. In direct sown size, when the crop is sown, the size of the canopy of the germinating seedling is given as a conservative parameter. These parameters can be reached in full mode only. In transplanting, the size of the transplant seedling should be specified by the user.
In the development tab (Fig. 7), the initial canopy cover depends on your type of planting method and plant density.
In the canopy development tab, the canopy development should be adjusted through your field observations and data. These parameters are directly used in crop-growing simulation and they should be adjusted for each cultivar and location separately (Fig. 8). Maximum canopy cover (CCx), that will be reached at mid-season, is generally around 75% up to 100%. CCx varies with crop type but it is also determined by planting density. CCx is specified by selecting one of the predefined classes or as direct input. The predefined classes are categorized based on typical canopy cover values observed under varying planting densities and crop management practices. Alternatively, direct input allows for the specification of exact CCx values tailored to experimental data or field-specific conditions.
Accurate specification of CCx is crucial, as it directly influences the simulation of crop growth dynamics, light interception, and potential yield outcomes. Ensuring compatibility between planting density and CCx parameters improves the model's reliability for decision-making in agricultural planning.
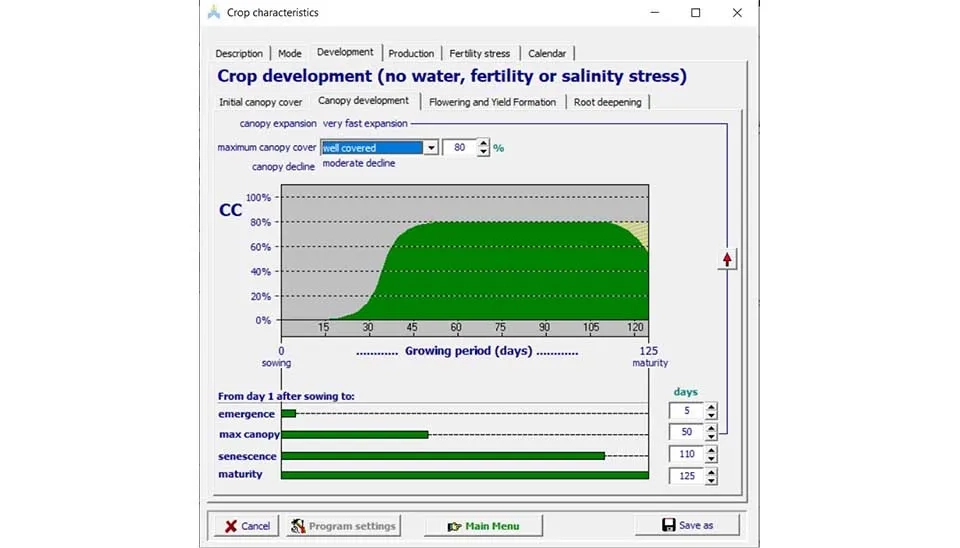
The root, depending on the last tab of developing input data, refers to the root zone of your plant. These parameters will be used for calculating the capillary rise in the root zone.
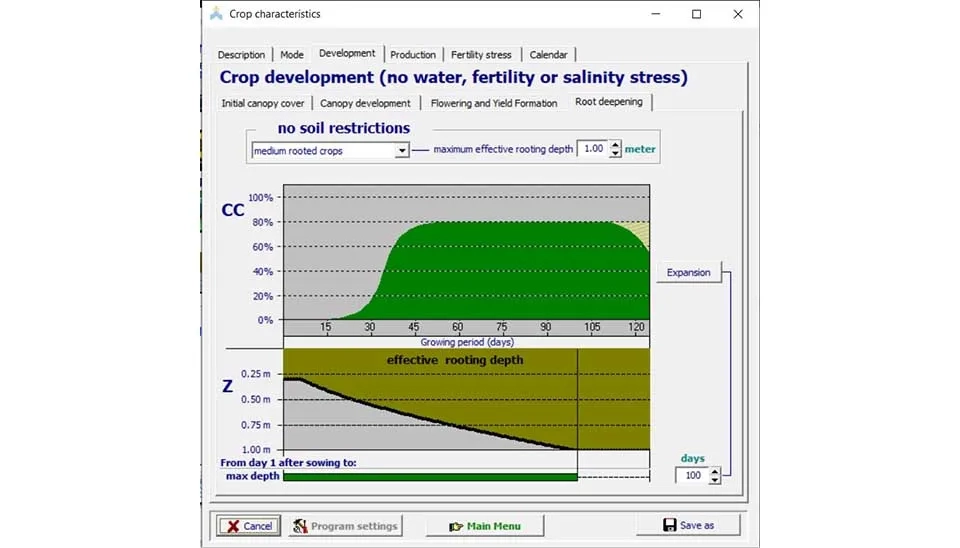
Maximum effective root depth could be affected by your soil characteristics. Although it could be one of your specific cultivar characteristics that should be entered by the user directly (Fig. 9).
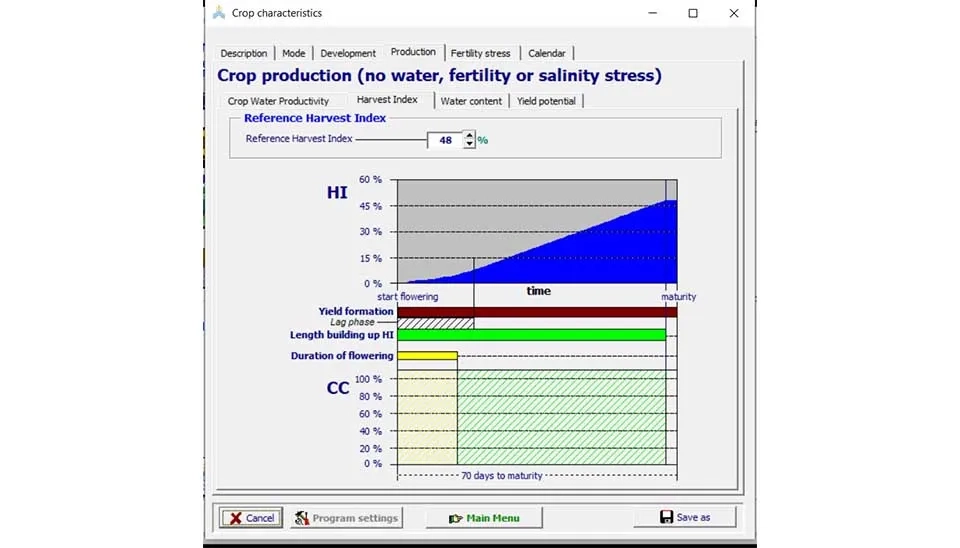
After completing this part in the production tab, the unique parameters of the AquaCrop model for simulating crop yield appear, including crop water productivity and harvest index. Water productivity is one of the conservative parameters that are estimated by the direct input data and adjusted during the simulation due to the effect of water and nutrient stress in the growing season. Harvest index is one of the important parameters that can be defined by the user directly. This parameter presents the harvestable portion of the produced biomass. This parameter is one of the key variables in the model calibration stage.
In the yield potential tab, the combination of input data in crop development and production and the potential biomass and yield have been shown. This could help with adjustments before the final run of the model.
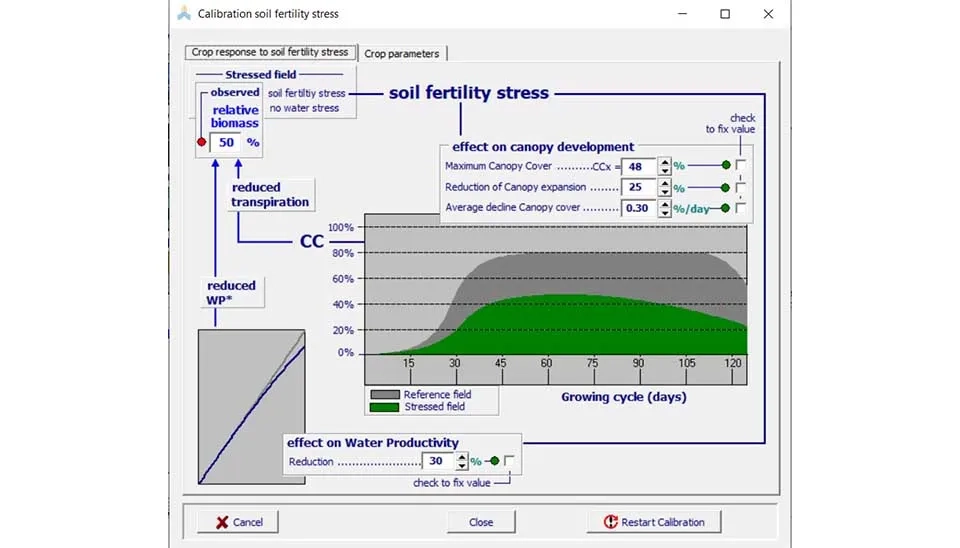
Fertility stress caused aboveground biomass (B) will be limited during the growing season. This is the result of a smaller canopy cover (CC) and a decrease of the biomass water productivity (WP). The soil fertility level during simulation is a field management characteristic, while the crop response to soil fertility stress should be defined as a crop characteristic . Since the effect of soil fertility stress is affected by the type of limiting nutrients and environmental conditions, such as climate and soil type, a calibration of the crop response to soil fertility stress is required and will most likely have to be repeated for each type of environment.
In Fig. 11, the main window of soil fertility calibration is presented. The effect of soil fertility is described by reductions in canopy cover, water productivity and biomass. These data should be gathered through field observation. These parameters could be defined as a reduction rate or final fixed values and directly entered by the user as input data in the model.
The calendar tab is the final tab of crop characteristics in limited mode (Fig. 12). All the important dates during the growing season will be shown here and there is a last chance for any adjustment in this tab.
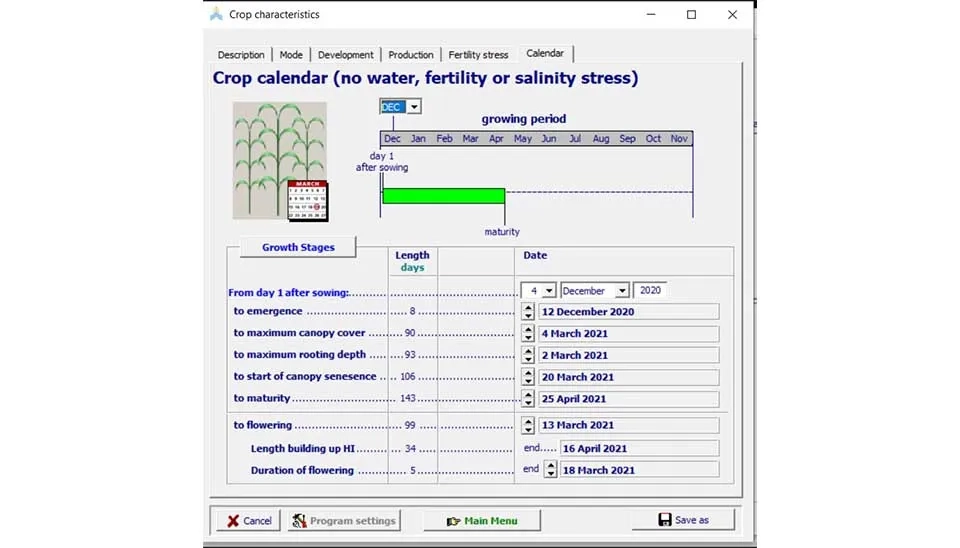
The common wheat root depth is 1.2 meters, and with no soil horizon, the root deepening in Al Ain farm was 1 meter. The appropriate time for wheat harvest is from the middle of April to the middle of May; that varies due to the temperature and sewing date. There is no fertility stress in soil and no water stress by the given irrigation schedule. The initial harvest index was determined to be 33% to gain the almost 4.5 tons/ha dry yield. Initial canopy cover was determined to be very high because of very intensive planting with direct sowing methods on the farm.
3.3. Management Data
In management data, all management activities will be entered as input data by the user. There are two categories for data entry: 1. irrigation management and 2. field management, and each of these will be explained as below:
3.3.1. Irrigation Data
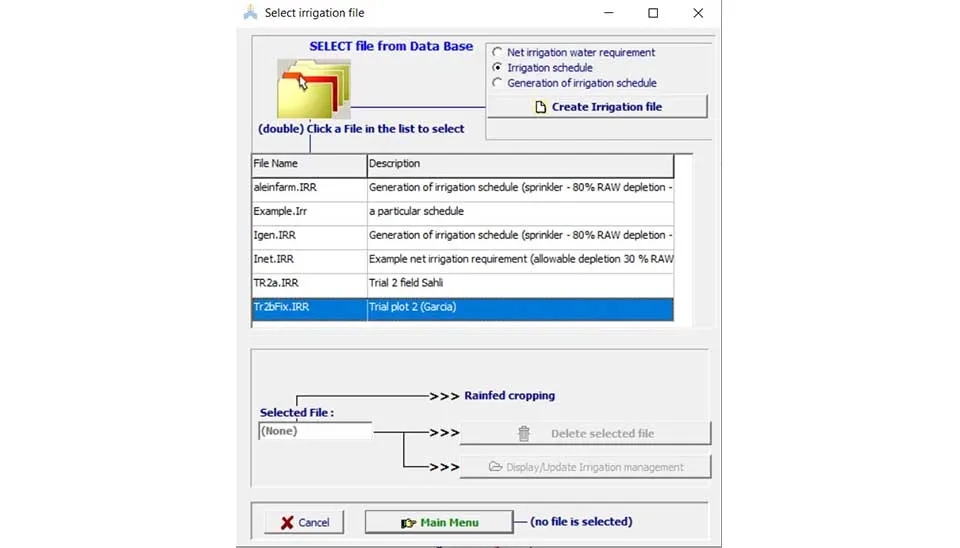
AquaCrop as a crop simulation model could estimate the net irrigation water requirement, generate an irrigation schedule or determine the efficiency of an existing irrigation schedule By using the irrigation schedule in the irrigation file window (Fig. 13). You can enter your irrigation schedule as input data to model. The rainfed cropping could be simulated in the model as well. At the end of the model run, irrigation adequacy could be assessed by the user with water balance estimated data.
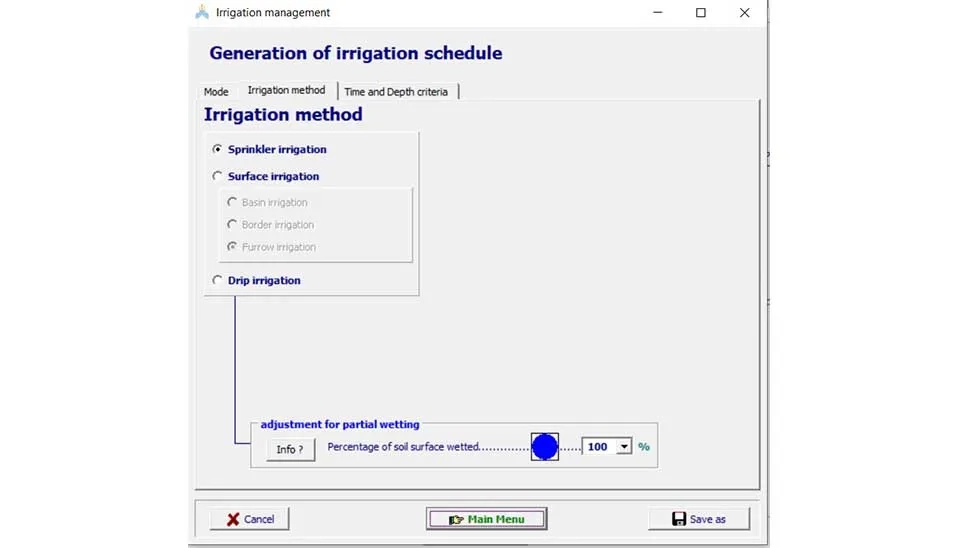
To enter the irrigation data, the first step is to choose the irrigation method and percentage of soil surface wetted in irrigation events. A guide for the upper and lower limits of each irrigation method is in the info bottom but generally this data should be determined by the irrigation designer or farm manager during the irrigation events.
The data required for the irrigation schedule includes the time and depth of irrigation water in all irrigation events during the growing season. The ECw, which shows the salinity of irrigation water, is an important parameter. This data is used in soil salinity calculations and salinity stress during the growing season.
For generating irrigation schedules by AquaCrop plant growth model, the model needs a criteria for calculating the time of irrigation event. This criteria could be a fixed interval that is usually used for irrigation design on farms, or it could be more complicated and use the soil water characteristics like allowable depletion and readily available water as it shows in Fig. 15. The depth of irrigation water could be fixed depending on soil characteristics .
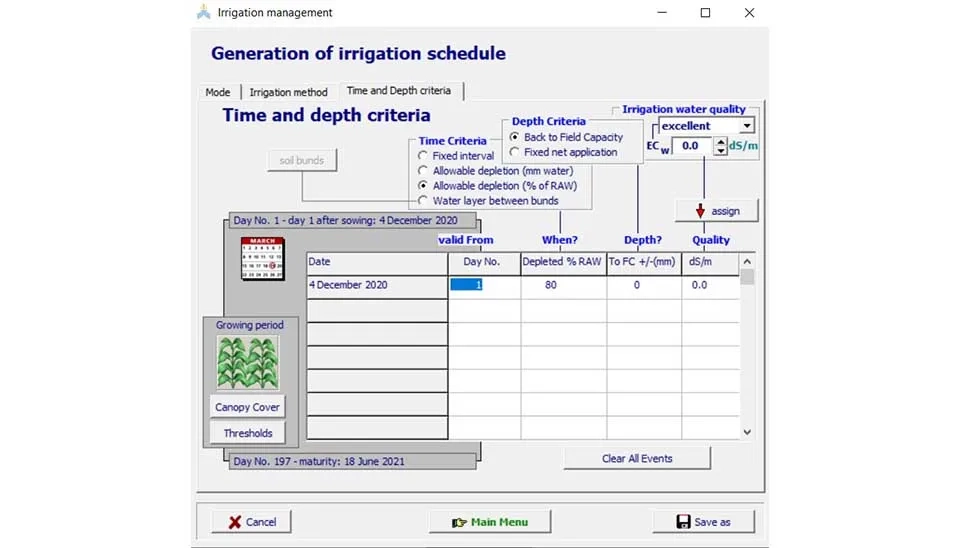
In Al Ain Farm, the present irrigation system is center pivot machines, which are categorized as sprinkler irrigation. The given schedule was 20 mm. Irrigation water at a fixed interval of 10 days with a moderate quality (ECw = 1.5 ds/m) enters the model manually and the irrigation file is created.
3.3.2. Field Management Data
Other field management than irrigation will be determined in this part, including soil fertility, mulches, field surface practice, weed management and multiple harvests.
Soil fertility calibration will be determined as a crop characteristic that was explained before. You can control the calibration in this window but for any changes, it's needed to go back to the crop characteristics window.
Mulches affect the soil evaporations and the type of these mulches and the coverage area are so important in the water balance simulated by the model.
The user-specific mulches could be defined by the reduction fraction in soil evaporation in the model.
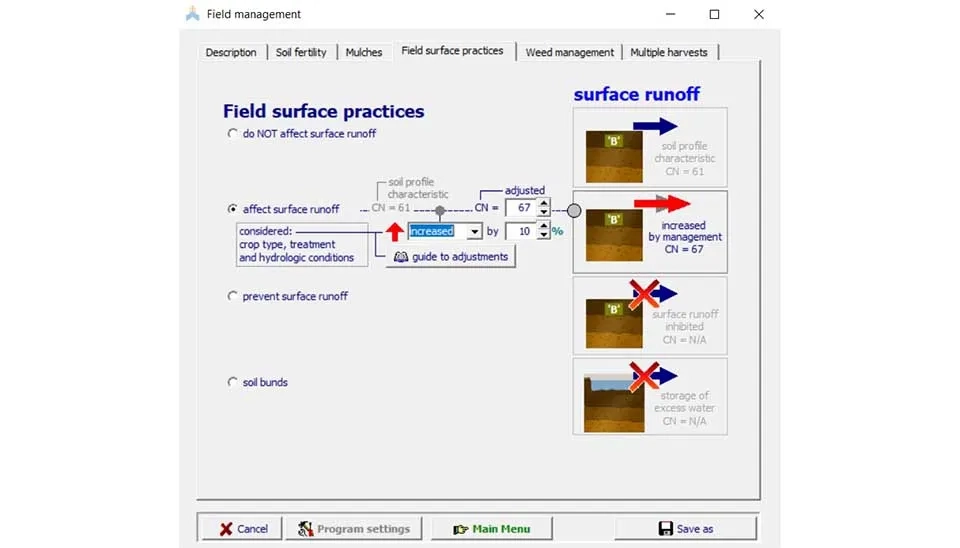
Field surface practice, including any Practices affecting or inhibiting surface runoff should enter as input data in the AquaCrop simulation model. These practices are categorized in four types due to their effect on runoff or soil bunds. In the case of affecting surface runoff, their affection in increasing or decreasing the curve number of surface soil could be defined by user (Fig. 16)
In AquaCrop, weed infestation is expressed by the relative cover of weeds (RC), which is the ratio between the ground area covered by leaves of weeds and the total canopy cover of weeds and crop. RC is easily determined by estimating the fraction of the total canopy cover that is weed. It can be assessed by a visual estimate in the field or by analysing photographs taken vertically from above the crop.
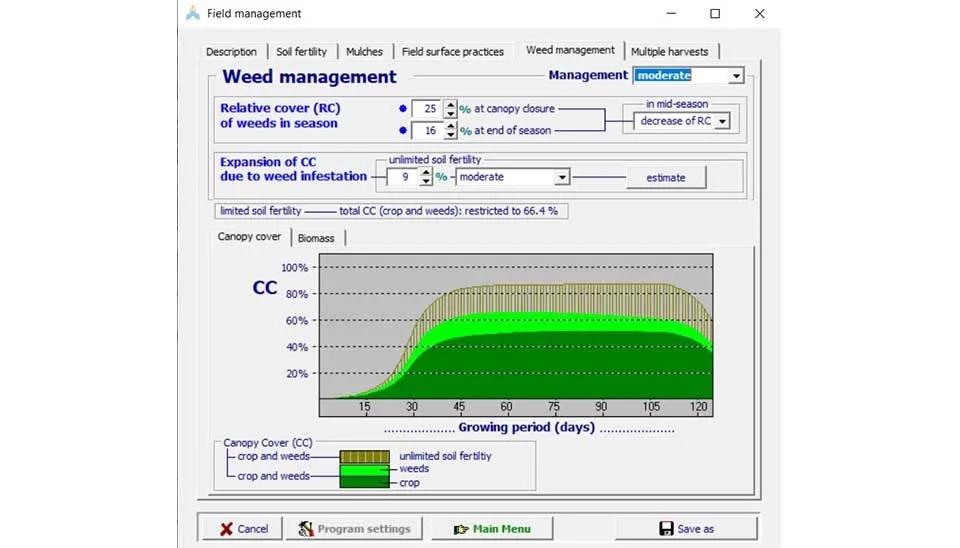
In the ‘Canopy cover’ tab of Weed management (Fig. 17), the corresponding total canopy cover of crop (dark green) and weeds (light green) in the weed-infested field is
displayed. The canopy cover for weed-free conditions (black line) is given as a reference.
3.4. Soil Data
Soil data consists of soil profile data and groundwater data will be entered by the user in this part. Although there are pre prepared soil files according to different soil textural classes as default data in the model, we can use some other models to specify the hydraulic characteristics of soil or use the laboratory data instead.
3.4.1. Soil Profile Data
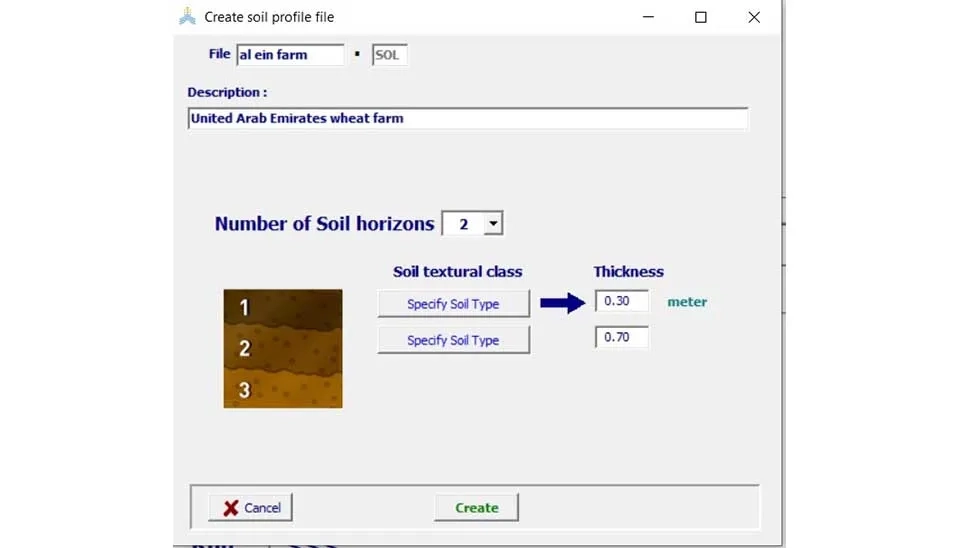
The first step of soil profile is to determine the number of soil horizons and their depth (Fig. 18). Soil profile data usually comes from field tests but there are some soil data banks of soil profiles that could help recognize the soil texture around the world. These data banks make data accessible with appropriate accuracy.
In the second step, all characteristics of each soil horizon consist of texture and critical soil moisture point and hydraulic conductivity at saturation, which should be entered as input data (Fig. 19).
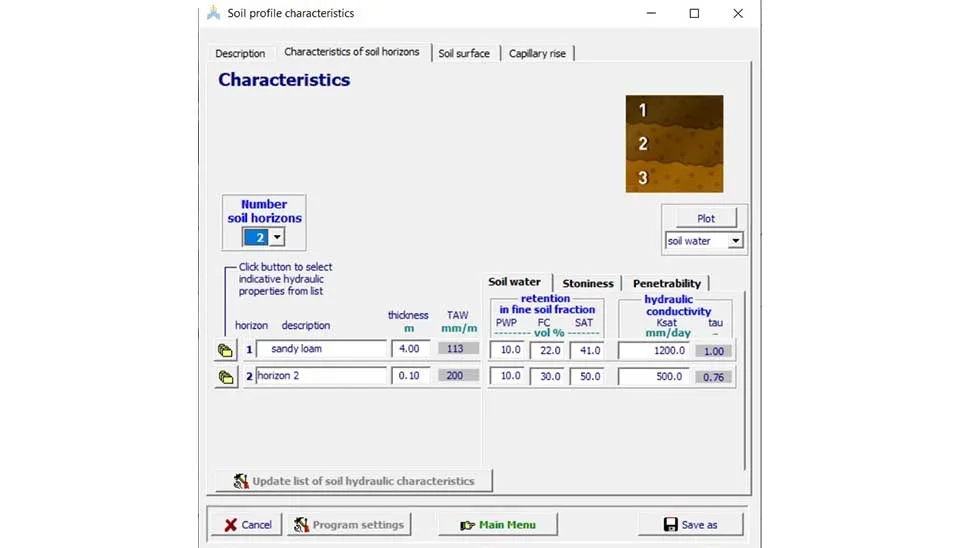
There is a guide in the model that can be used for updating the soil characteristics by their texture class (Fig. 20).
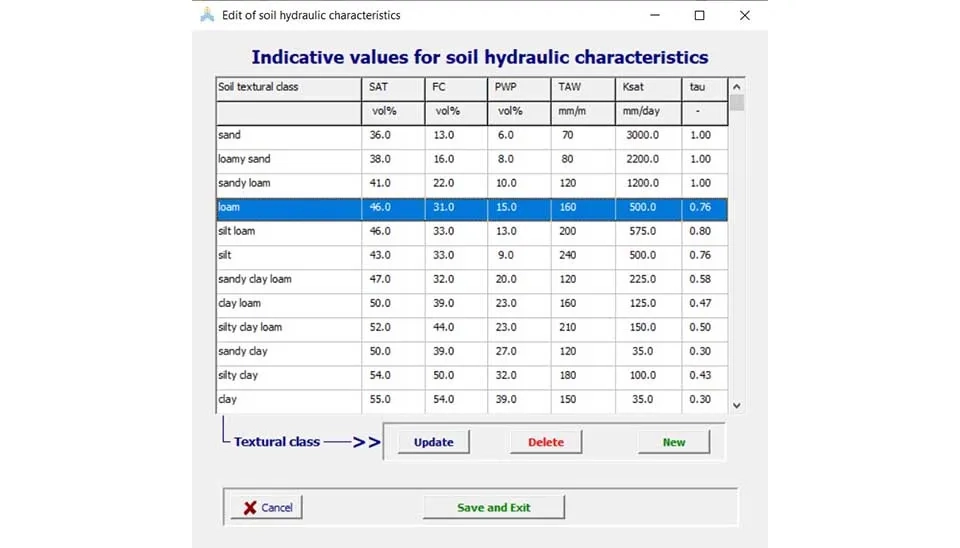
Soil surface tab describes the curve number of soil surface. There are some guidelines for determining the curve number of soils and their classifications.
The maximum total depth of water that can be evaporated from the surface soil layer which is termed "total evaporable water," or TEW and the maximum total depth of water that can be evaporated during stage 1 is termed "readily evaporable water," or REW. Table 1 includes recommended values for REW.
Table 1. Recommended value for REW (Allen, 1998)
Soil Texture Classification | REW (mm) |
Sand | 2 - 7 |
Loamy sand | 4 - 8 |
Sandy loam | 6 - 10 |
Loam | 8 - 10 |
Silt loam | 8 - 11 |
Silt | 8 - 11 |
Silt clay loam | 8 - 11 |
Silty clay | 8 - 12 |
Clay | 8 - 12 |
The last tab in soil profile characteristics describes the capillary rise, which is related to the depth of groundwater in the farming lands. The most important point in capillary rise is its direct affection in water balance in the root zone. If the depth of groundwater is more than 10 meters, the capillary rise effect will be zero.
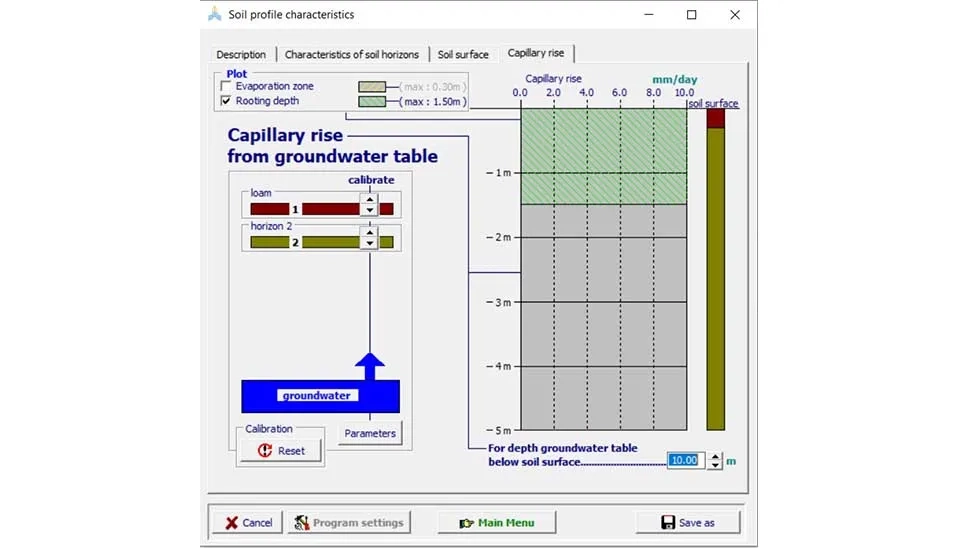
Soil data for Al Ain farm was extracted from Harmonized World Soil Database v2.0 and the soil profile characteristics were extracted by AquaCrop soil guide in the model.
3.4.2. Groundwater Data
The groundwater table could be constant or varying during the growing season. These input data are usually based on long-term observed data around the field. This data is linked to the capillary tab and will be corrected after creating and saving the groundwater file.
There is no Aquifer in Al Ain farm zone. Therefore, no capillary rise will happen during the growing season, which means that no groundwater table is determined in the model.
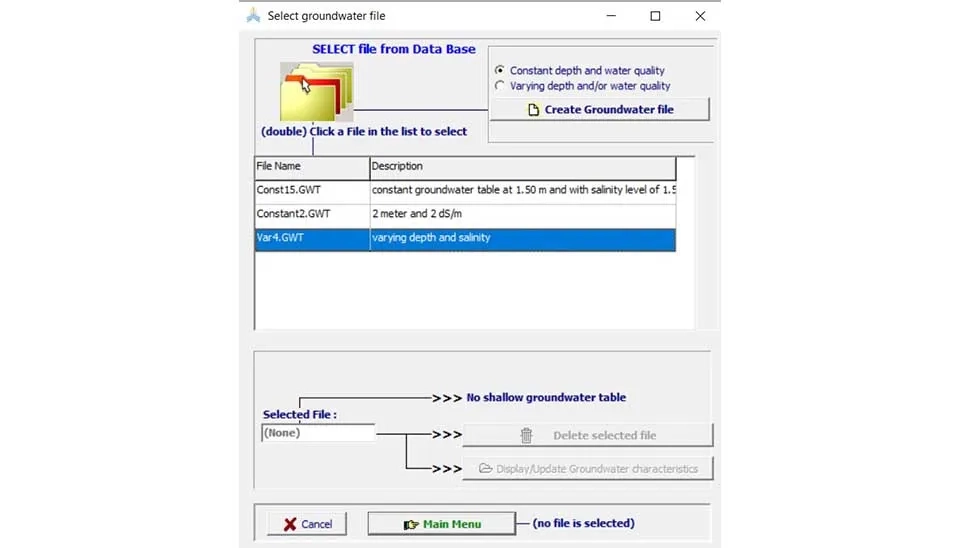
The needed data for the groundwater table is the time, depth and salinity of each data observation event.
3.5. Simulation
To start the simulation process, most of the needed data have been described in previous stages. One of the needed data points for starting the simulation is initial conditions. One of the common initial conditions is soil water and salinity that let users define the final condition of soil water and salinity before sewing for more accuracy in the simulation process. Soil moisture meters could give live and updated data, which helps you to improve the accuracy of your simulation.
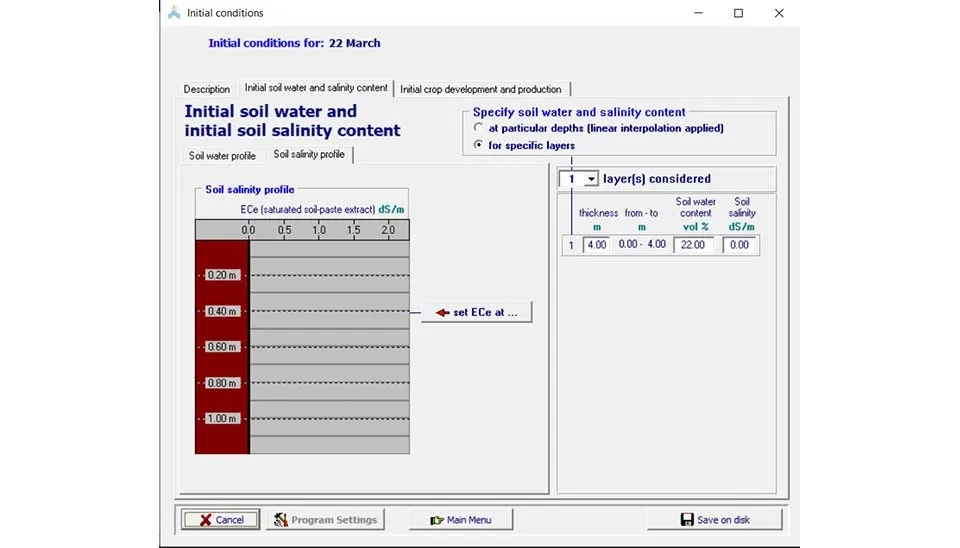
Initial crop development and production are linked with the crop characteristics main window, the tab of development and production that describe before.
The project bottom lets you save all files as a project and run them in single or multiple runs for successive years.
Field data bottom lets you add your observation data and compare them with simulated values.
In the simulation run main window, you can choose the time step of running or choose a specific date in the growing season for showing the result of simulation. The default of the model is to simulate the end of the season and all results will be at the end date (Fig. 24).
4. Output Data
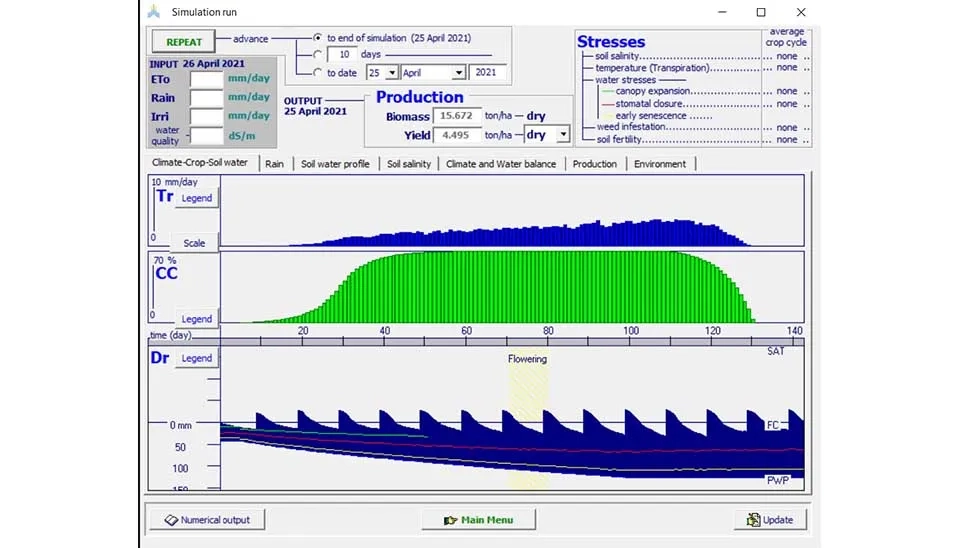
In the simulation main window and after running the program (Fig. 23), the main information is the simulated biomass and yield at the end of the season. The stress box indicates the stresses that affected your crop yield during the season.
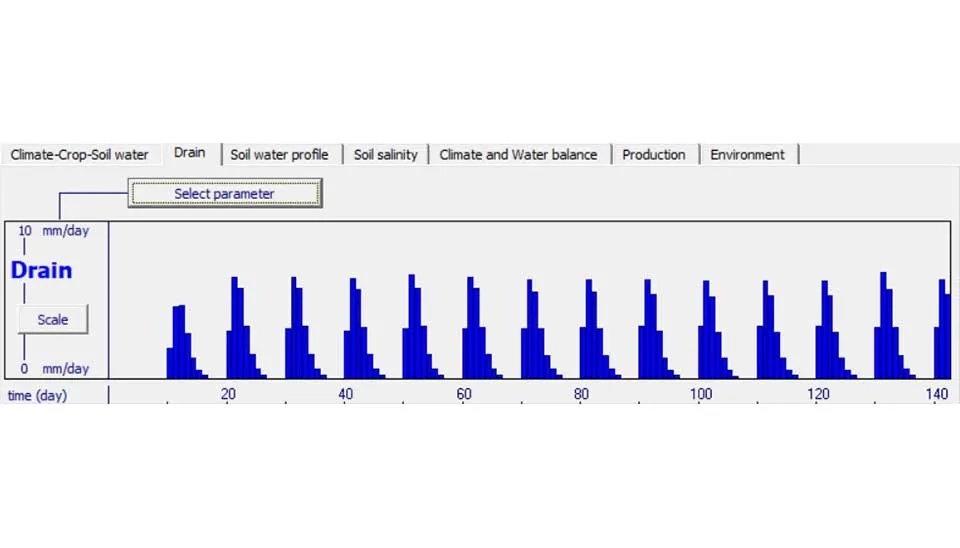
AquaCrop plant growth simulation models have the option of graphical data in the simulation main window. In the rain tab, by choosing any parameter, the simulation values and their fluctuation during the season will be shown graphically. In Fig. 25, the deep percolation presented during the growing season graphically.
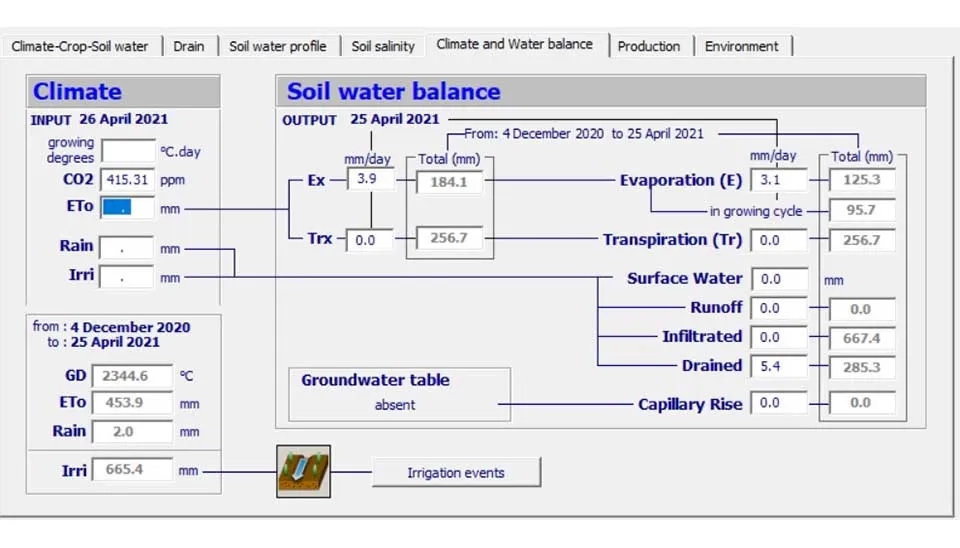
One of the most important outputs of AquaCrop is water balance at the end of season (Fig. 26) In this box, the estimated values of evaporation, transpiration and runoff, infiltrated and drained water during the season will be shown. These data could be used for assessment given the irrigation schedule.
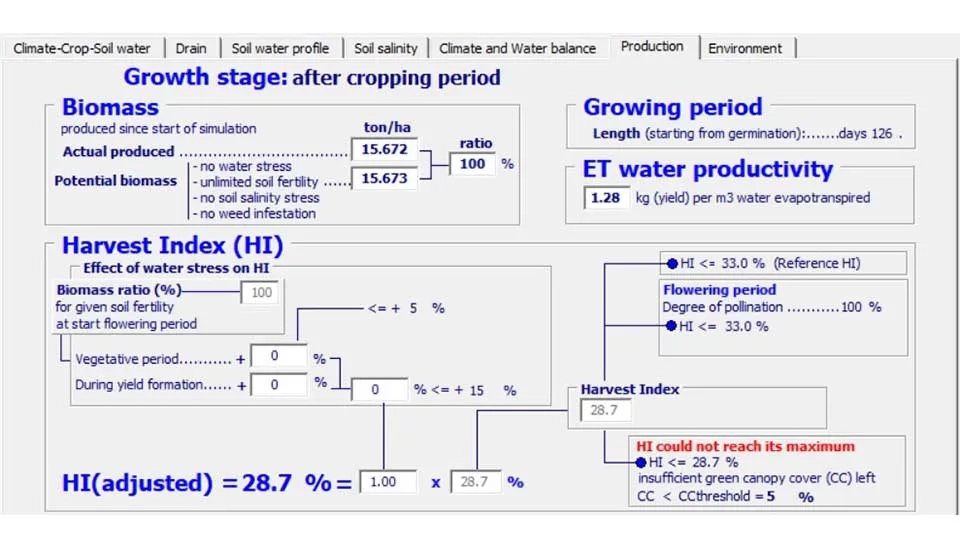
In the production tab, the actual production and adjusted HI will be shown. Besides, the calculated ET water productivity will be presented as well.
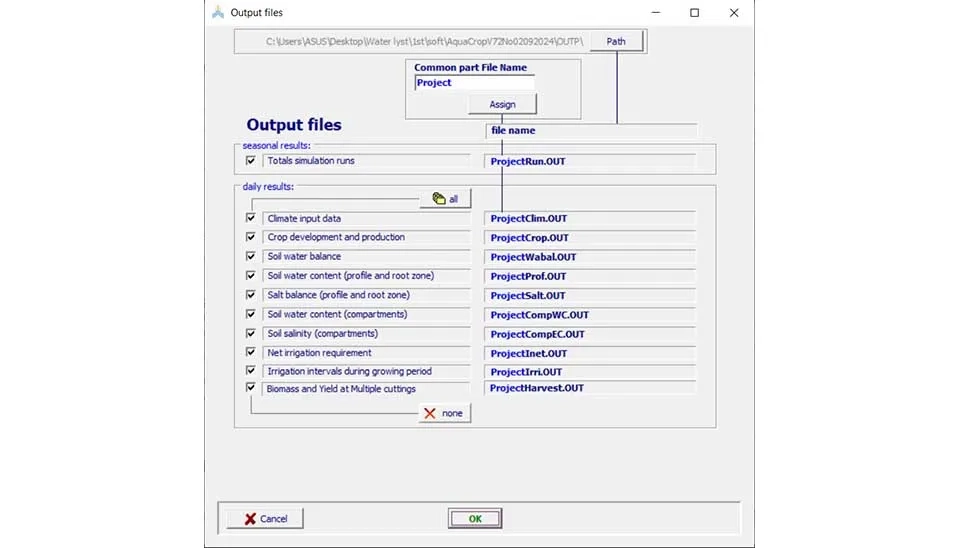
All data in the simulation run main window can be presented as a table in the numerical output bottom. This data could be saved as text files before leaving the simulation run window (Fig. 28).
In Al's farm, the calculated yield is 4.5 tons/ha, which is compatible with observed data. The adjusted harvest index in this farm is 28%, which is lower than the initial value and the model commented that insufficient canopy cover caused the HI to not reach the maximum value. This means that the growth of canopy cover is limited so it is essential to revise the planting density of time of sewing in the future.
The total evapotranspiration on this farm is 453 mm and the total irrigation is 665 mm. According to the low amount of rainfall in the growing season, all needed water for planting comes from irrigation water,But the amount of drained water shows that more than one-third of irrigation water was drained from the root zone. This means that the irrigation schedule could be improved and redesigned to decrease the drained water. The soil salinity shows the cumulative amount of salt in the root zone. This accumulation could cause salinity in the future. In this case, the leaching portion of irrigation water should be revised every few years according to the live situation of soil salinity and irrigation water quality.
5. Calibration
The Advanced AquaCrop simulation model key point is user-friendly and has few input data. From 2009 till 2023, various studies were conducted to calibrate this model around the world. Most of these studies are available as default crop files in the model. On the other hand, there are some options in the model that let you create new crop files through your studies.
In crop data, there is a full mode that lets you reach conservative crop parameters that are not related to the local environment of planting.
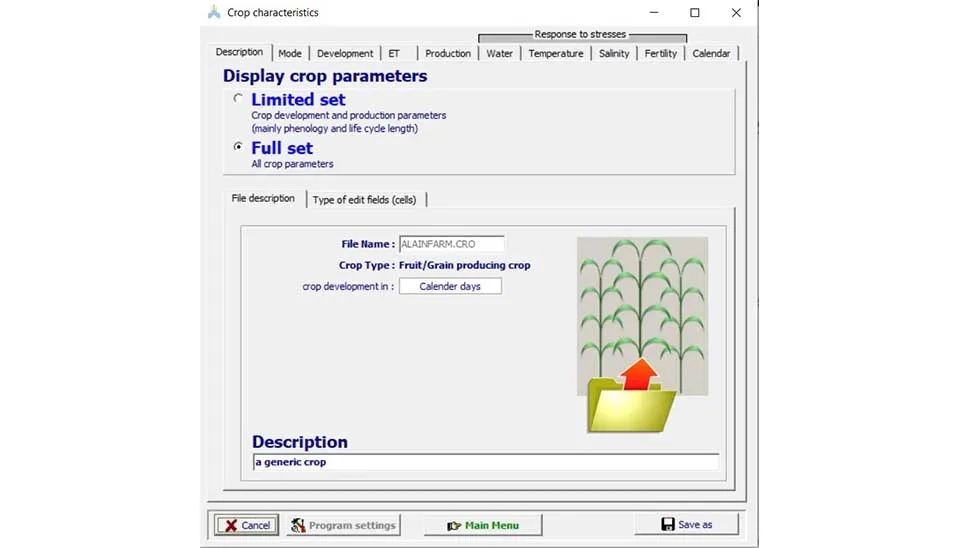
Fig. 29 presents the crop characteristics main window in full mode. In this mode, some new tabs will appear for professional users to have the deep calibration or even define a new crop.
Crop transpiration is calculated by multiplying the reference evapotranspiration (ETo) with the crop transpiration coefficient (KcTr) and by considering a water stress (Ks) and cold stress (KsTr,x) coefficient, which are 1 when stress does not induce stomatal closure.
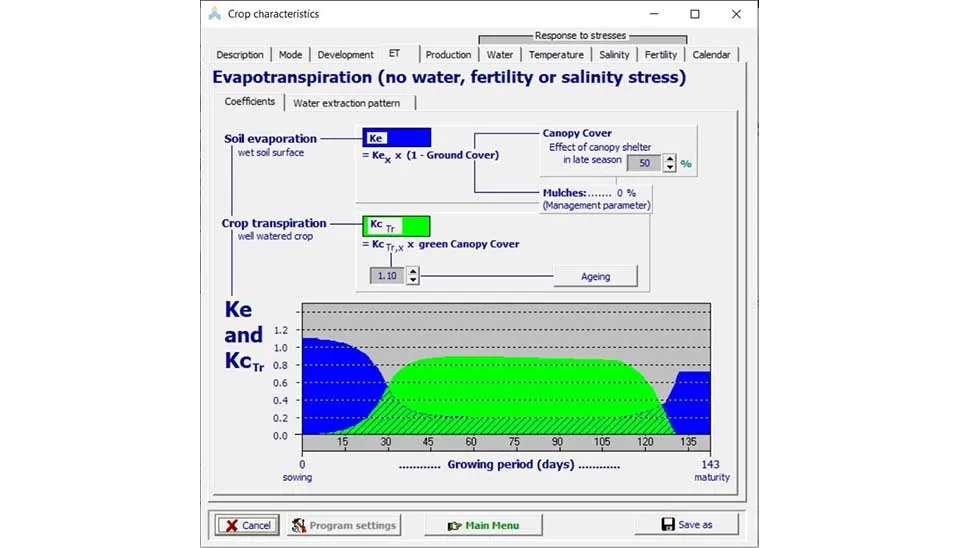
where KcTr,x is the crop coefficient for maximum crop transpiration (determined by the characteristics that recognize the crop with a complete canopy cover from the reference grass). For most crops, KcTr,x is in the range of 1.05 up to 1.20. KcTr,x which is adjusted downwards for aging throughout the crop cycle and senescence of the crop.
The effect of water stress on crop transpiration is simulated by the water stress coefficient (Ks) with KcTr,x as the main crop parameter. If the stress is caused by the shortage of water, a soil water stress coefficient for stomatal closure (Kssto) is considered. If the stress is caused by the excess of water, a soil water stress coefficient for water logging or deficient aeration (Ksaer) is considered. When the water content in the root zone drops below the threshold for Ksaer or is above the threshold for Ksaer, the stress coefficient becomes smaller than 1 and crop transpiration declines. These coefficients are the professional tools for deep calibration.
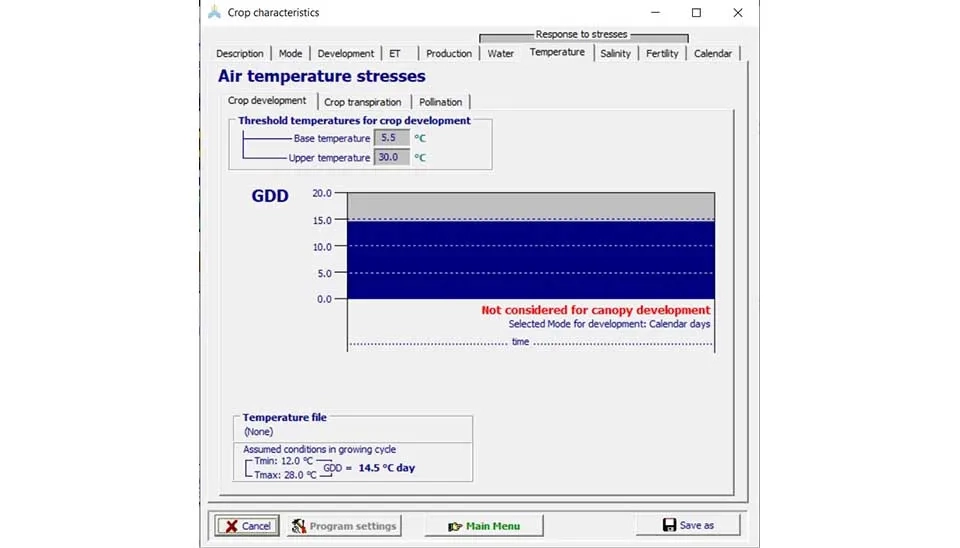
In the temperature tab (Fig. 31), the needed data for cold stress will appear, including the upper and base temperatures for crop development. To simulate the effect of cold stress, a temperature stress coefficient for crop transpiration (KsTr) will be considered. The growing degree days (GDD), which can be generated in a day, are used as the stress indicator to describe cold stress on crop transpiration.
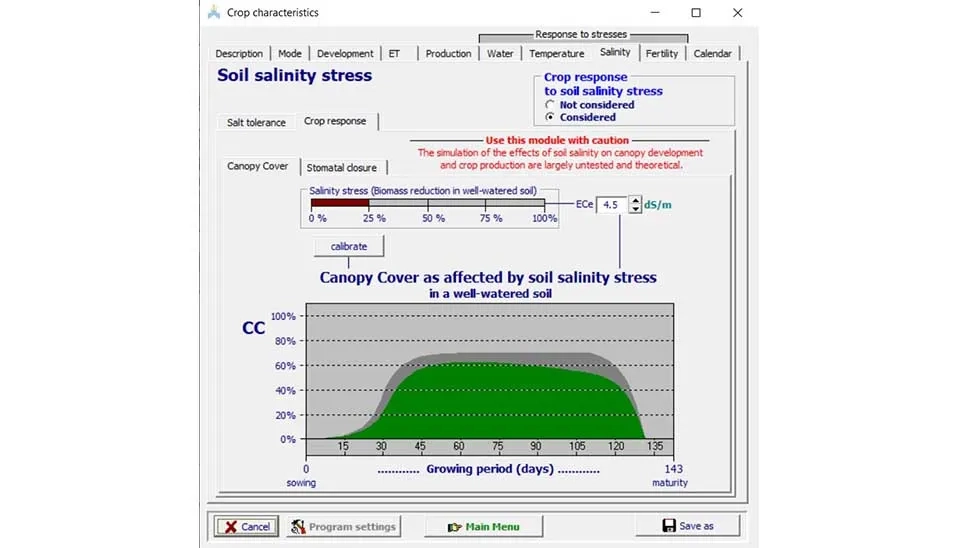
Soil salinity stress is simulated with a soil salinity stress coefficient (Kssalt). The average electrical conductivity of the saturation soil (ECe) from the root zone is the indicator for soil salinity stress. The upper and lower thresholds for ECe are crop-specific In the temperature tab (Fig. 31), the needed data for cold stress will appear, including the upper and base temperatures for crop development. To simulate the effect of cold stress, a temperature stress coefficient for crop transpiration (KsTr) will be considered. The growing degree days (GDD), which can be generated in a day, are used as the stress indicator to describe cold stress on crop transpiration.
Soil salinity stress is simulated with a soil salinity stress coefficient (Kssalt). The
average electrical conductivity of the saturation soil (ECe) from the root zone is the
indicator for soil salinity stress. The upper and lower thresholds for ECe are
crop-specific and will be the input data in this tab.
Soil salinity stress causes smaller canopy cover (CC) and a closure of the stomata.
Smaller canopy cover: Soil salinity stress decreases the growing capacity of the crop
as well as the maximum canopy cover (CCx) that can be reached at mid-season. Due to
the salinity stress in the soil, canopy cover will steadily decline at mid-season.
Stomatal closure: Due to osmotic forces, the salts in the root zone make the water
less available to the crop, which will be the input data in this tab.
Soil salinity stress causes smaller canopy cover (CC) and a closure of the stomata.
Smaller canopy cover: Soil salinity stress decreases the growing capacity of the crop as well as the maximum canopy cover (CCx) that can be reached at mid-season. Due to the salinity stress in the soil, canopy cover will steadily decline at mid-season.
Stomatal closure: Due to osmotic forces, the salts in the root zone make the water less available to the crop.
When soil salinity stress occurs, AquaCrop adjusts the values of stress coefficients (affecting canopy development and stomatal closure), which means that the simulated crop transpiration and the corresponding biomass (B) become equal to the required reduction given by Ksalt.
Soil salinity calibration should be done with caution that reminds the developer of the model (Fig. 32). This calibration needs a high theoretical background and is very detailed laboratory tests.
6. Conclusion
The AquaCrop crop simulation model is one of the user-friendly and water-driven models developed by F.A.O. This model could help in predicting the crop yield and generating an irrigation schedule or net water requirement of your planting schedule during the season. However, it could help you to calculate the effect of water deficit or other stresses like temporal or salinity stress in your expected yield at the end of the season.
This model provides good tools for academic and practical studies related to crop yield and water productivity. As the AquaCrop source code is available, it can be used in combination with other models and software to vast the area of studies.
This model could be used for any feasibility studies or economical assessment of new farms all around the world through the difference in climate and water resources quality and quantity. Farmers and engineers are the practical users of this model. Although global warming and climate change, this model can be used for any climate change assessment in agricultural production.
