How long can you predict the temperature of your place? One day? A week? At least one month? Now imagine that we want to predict the temperature of the entire world until the year 2100. How amazing! Follow us in this article so that you too can predict the temperature until the year 2100!
Climate change scenarios have been considered in global change assessment studies in recent decades. Climate change scenarios provide frameworks in which future climates are projected to enable integrated research and coherent assessment of alternative futures for climate and society. Researchers have accepted climate change scenarios to respond to their needs; however, they face challenges and limitations from the research perspective (O’Neill et al., 2020).
The climate change scenarios predict global warming and its effects on the earth's climate, ecosystems, and human society, which are useful in predicting the warning and knowing its effects in advance. A set of climate change scenarios has been published in the assessment reports of the Intergovernmental Panel on Climate Change (IPCC) and the Coupled Model Intercomparison Project (CMIP). The scenarios included in the IPCC and CMIP provide a set of climate change scenarios with different levels of prediction. Past studies show that the climate change scenarios presented by IPCC and CMIP have been able to predict climate change to an acceptable extent despite the conservative considerations until 2020 (Carvalho et al., 2022). In this article, the scenarios provided by CMIP are presented along with different levels of projection to gain a deeper understanding of the future climate.
1. Climate Change Scenarios in IPCC Assessment Reports
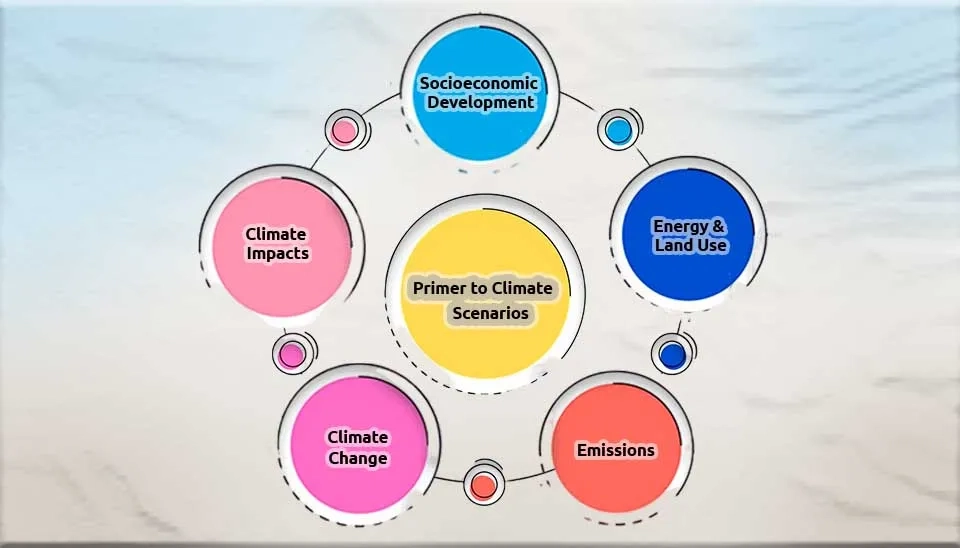
Climate change scenarios (emission scenarios; greenhouse gas scenarios) have been welcomed by researchers in future climate research and assessment. Climate change scenarios based on the prediction of energy and food systems have been able to predict greenhouse gases, air pollutants and aerosols, and future land use, which are used in climate change research, impact assessment, and mitigation. Climate change scenarios play a key role in national and international policies to advance sustainable goals; therefore, they have been considered in various agreements, such as the Paris Agreement on Climate Change (Pedersen et al., 2022; Riahi et al., 2017). In the following, we will discuss the scenarios mentioned in each of the IPCC assessment reports.
1.1. IPCC First Assessment Report Scenarios, 4 Scenarios
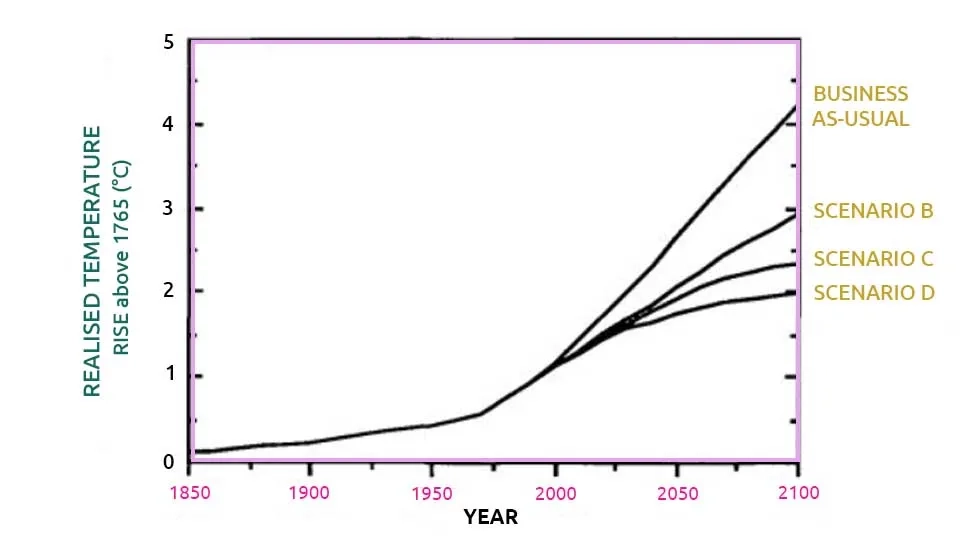
The first generation of climate change scenarios or emission scenarios was published in the IPCC First Assessment Report. These scenarios were developed in response to the Steering Group of the Response Strategies Working Group by the United States and the Netherlands, which include the emission of carbon dioxide (CO2), methane (CH4), nitrogen oxide (N2O), chlorofluorocarbons (CFCs), carbon monoxide (CO), and nitrogen oxides (NOx). The IPCC First Assessment Report consists of four business-as-usual scenarios (Scenario A), Scenario B, Scenario C, and Scenario D. A detailed description of each scenario is given below (FAR Scientific Assessment, 1990; FAR Synthesis Report, 1992):
Business-as-Usual scenarios (Scenario A): Scenario A is based on a large supply of coal power and a slight improvement in efficiency on the demand side. It is also expected that methane and nitrous oxide emissions from uncontrolled agriculture and deforestation will continue until the tropical forests are depleted.
Scenario B: In this scenario, lower-carbon fuels, especially natural gas, are obtained along with large increases in efficiency. Carbon monoxide controls are strict, deforestation is reversed, carbon monoxide and agricultural emissions are controlled and limited, and the Montreal Protocol is implemented.
Scenario C: In scenario C, renewables and nuclear energy will increase in the second half of the 21st century and CFCs will be gradually eliminated.
Scenario D: In scenario D, renewables and nuclear energy are welcomed in the first half of the 21st century, and carbon dioxide emissions are reduced to 50% of 1985 levels in the middle of the next century.
Under the Business-as-Usual scenario (Scenario A), Scenario B, Scenario C, and Scenario D, the global mean temperature increases by 3°C, 2°C, 1°C, and 0.1°C, respectively, in each decade (FAR Scientific Assessment, 1990; FAR Synthesis Report, 1992).
1.2. IPCC Second Assessment Report Scenarios, 6 Scenarios
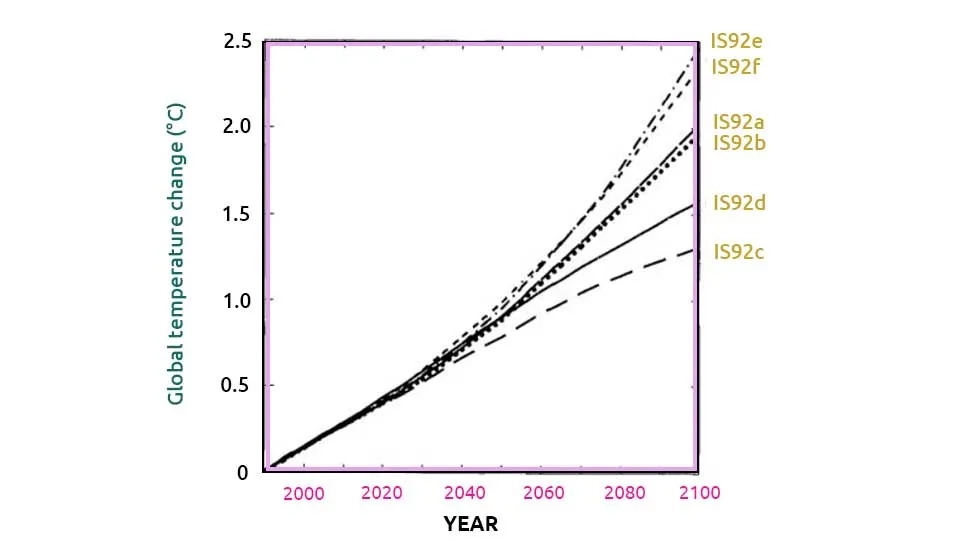
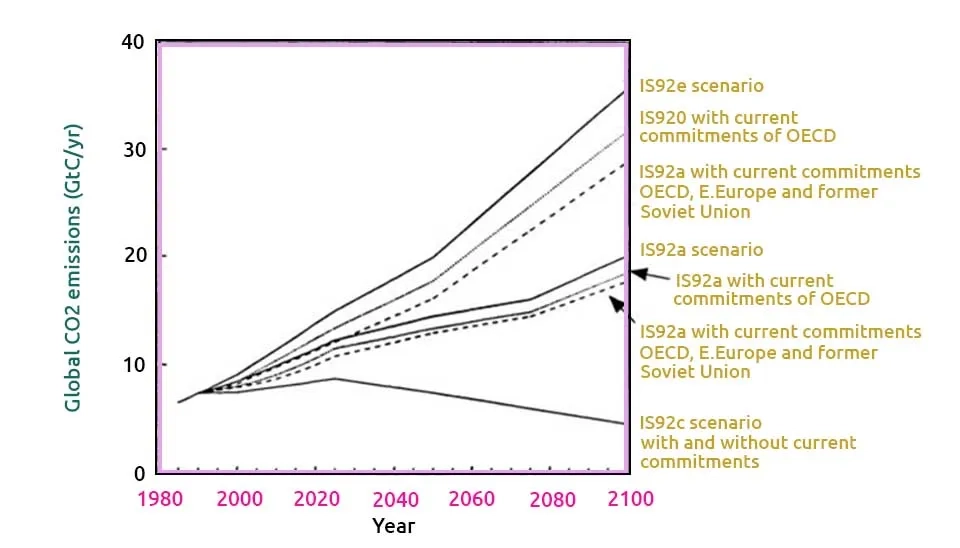
The IPCC Second Assessment Report presented a range of greenhouse gas and aerosol emission scenarios based on assumptions about population growth, economic growth, land use, technological change, energy availability, and fuel mix over the period 1990–2100, known as IS92 (IS92a–f) emission scenarios. These scenarios are extended until the year 2100 and include the emission of CO2, CH4, N2O, and halocarbons. All IS92 emission scenarios indicate an increase in greenhouse gas concentrations from 1990 to 2100. Projected global temperature increases under IS92 emission scenarios are shown in the figure below (SAR Synthesis Report, 1995; SAR Science Report, 1995).
IS92 climate change scenarios in six pathways are as follows (Alcamo et al., 1995):
IS92c: The IS92c pathway, also known as low emissions, assumes that population and economic growth will be low and that there will be severe constraints on fossil fuel supplies. Therefore, in the IS92c pathway, CO2 emissions are predicted to be lower than other scenarios and CO2 concentrations will decrease after 2050.
IS92e: In the IS92f pathway (high emission), it is assumed that population growth is medium and economic growth is high. It is also expected that fossil fuels will be available and nuclear energy will be gradually eliminated. Therefore, the highest CO2 emissions and non-stabilization of CO2 concentration before 2100 are predicted in this scenario.
IS92a: The IS92a scenario predicts a moderate trajectory based on balanced population and economic growth and moderate fossil fuel resources. Under this scenario, CO2 emissions are expected to be moderate and CO2 concentrations will double in 2070 compared to pre-industrial levels.
IS92b: This scenario is very similar to IS92a; however, it takes into account the commitments of some OECD countries to stabilize CO2 emissions. This scenario, known as the Stabilization Commitments scenario, predicts moderate CO2 emissions.
IS92d: This scenario, similar to IS92c, assumes limited population growth where economic growth rates are higher. This scenario has the second-lowest estimate of future emissions without doubling pre-industrial CO2 concentrations by the year 2100.
IS92f: This scenario is based on the highest population estimate and lower economic growth assumptions. Therefore, the second scenario of high emissions and the lack of concentration stabilization before 2100 are the characteristics of this scenario.
1.3. IPCC Third Assessment Report Scenarios; Special Report on Emissions Scenarios (SRES), 4 Scenarios
Since 1996, the IPCC has sought to develop greenhouse gas emission scenarios and replace them with the IS92 scenarios. The Special Report on Emission Scenarios (SRES) consists of four projection pathways that were published in the IPCC Third Assessment Report. The scenarios included in the Special Report on Emission Scenarios describe the relationships between emission-driving forces, their evolution, and quantitative climate changes. They also describe demographic, economic, and technological factors in the emission of greenhouse gases and Sulphur.
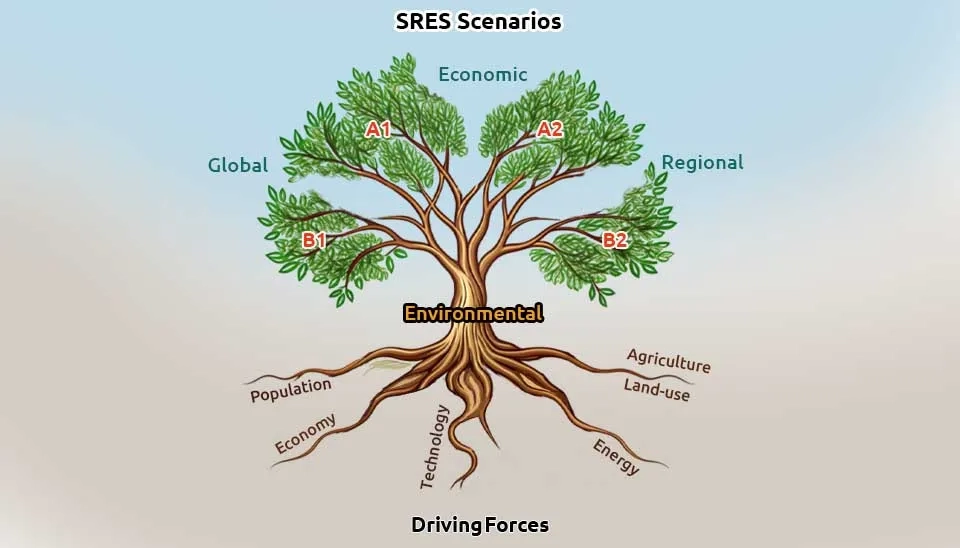
The SRES scenarios include A1, A2, B1, and B2, which form a "family" scenario. The details of each of the SRES scenarios are as follows (TAR Scientific Basis, 2001):
A1: In scenario A1, it is assumed that economic growth will be very fast in the future, new and more efficient technologies will be invented, and the world's population will reach its peak in the middle of the 21st century and should decrease after that. According to scenario A1, cultural and social interactions between communities and nations are expected to increase and regional differences, such as differences in per capita income, will decrease. Based on the alternative directions of technological change in the energy system, scenario A1 is divided into 3 groups: fossil-intensive (A1FI), non-fossil energy sources (A1T), or a balance across all energy sources (A1B).
A2: Scenario A2 is based on self-reliance, preservation of local identity, and international heterogeneity, where fertility patterns across regions converge slowly and population increases continuously. As a result, economic development and technological changes in scenario A2 are regional and fragmented.
B1: Scenario B1 is based on globalisation, which, similar to scenario A1, reaches its peak in the middle of the 21st century and then decreases. In this scenario, attention is paid to global solutions for economic, social, and environmental sustainability, and the economic system seeks to improve without additional climate initiatives.
B2: In scenario B2, it is assumed that local solutions are provided for economic, social, and environmental sustainability. In this scenario, the world population increased at a lower rate than in A2 and technological changes were slower and more diverse than in B1 and A1. This scenario emphasizes environmental protection and social equality at local and regional levels.
1.4. IPCC Fourth Assessment Report Scenarios, 6 Scenarios
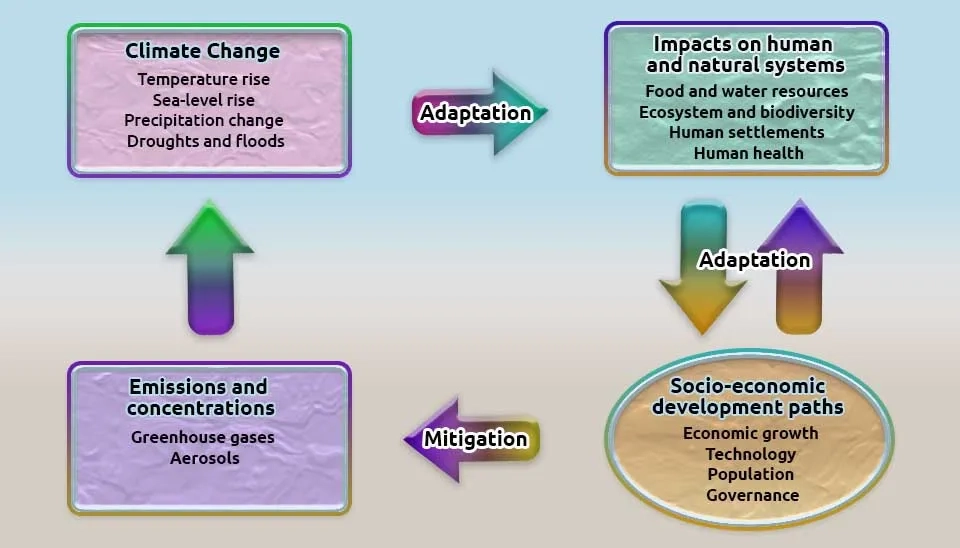
The scenarios included in the IPCC Fourth Assessment Report are the Special Report on Emissions Scenarios (SRES); however, compared to the IPCC Third Assessment Report Scenarios, they provide updated information on projected future climate in the 21st century and beyond, with special emphasis on aspects of human well-being and development. The scenarios included in the previous reports considered a lesser effect of some emission drivers, especially the population forecast, which was modified in the current version. Advances in climate change modelling have also improved the ranges of assessed probabilistic uncertainty, increasing confidence in projected patterns of temperature increase and other regional-scale features, including changes in wind patterns, precipitation, extreme events, and sea ice. However, the resulting projections are consistent with the IPCC Third Assessment Report Scenarios (1.4 to 5.8 °C) (AR4 Synthesis Report, 2007).
SRES scenarios predict that fossil fuels will maintain their position in world energy until 2030 and beyond, and greenhouse gas emissions will increase on a global scale from 9.7 to 36.7 GtCO2-eq (25 to 90%) in the period 2000–2030. Therefore, the SRES scenarios projected global temperatures to rise by about 0.2°C per decade for a range of scenarios up to the next two decades, and after that, temperature projections depend on specific emission scenarios (AR4 Synthesis Report, 2007).
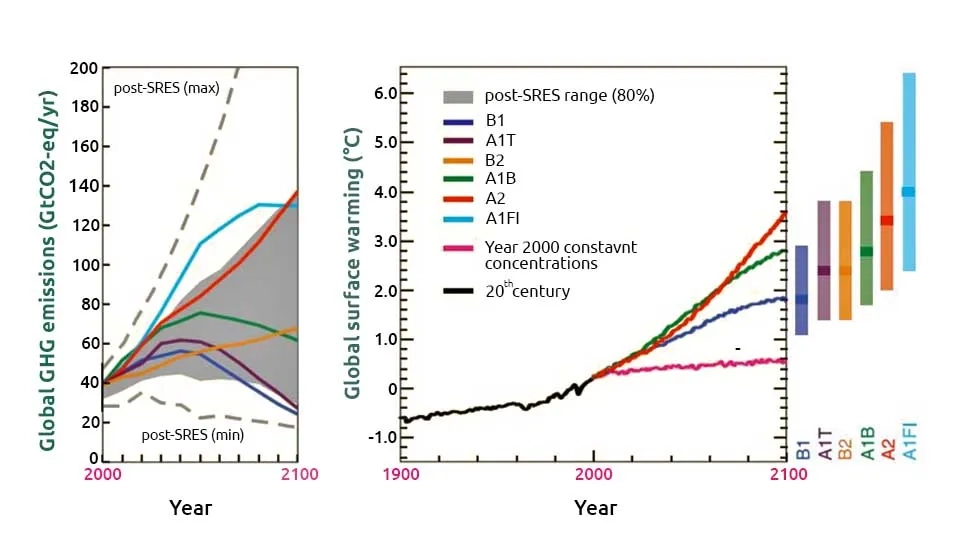
1.5. IPCC Fifth Assessment Report Scenarios; Representative Concentration Pathway (RCPs), 4 + 3 Scenarios
Compared to the IPCC Fourth Assessment Report, the IPCC Fifth Assessment Report achieved improvements in climate models that led to a more complete and accurate description of the uncertainty in long-term forecasts, such as improved simulation of surface temperature on a continental scale, simulation of precipitation patterns on a large scale, improving the ability to simulate the thermal expansion of oceans, glaciers, and arctic ice sheets, and improving sea level forecasting, monsoons, the carbon cycle, extreme events, atmospheric and aerosol chemistry, stratospheric ozone effects, and the El Niño-Southern Oscillation. However, the predictions of the IPCC Fifth Assessment Report and IPCC Fourth Assessment Report climate models in simulating large-scale change patterns have been in general agreement and their uncertainty has not changed significantly (AR5 Physical Science Basis, 2013; AR5 Synthesis Report, 2014).
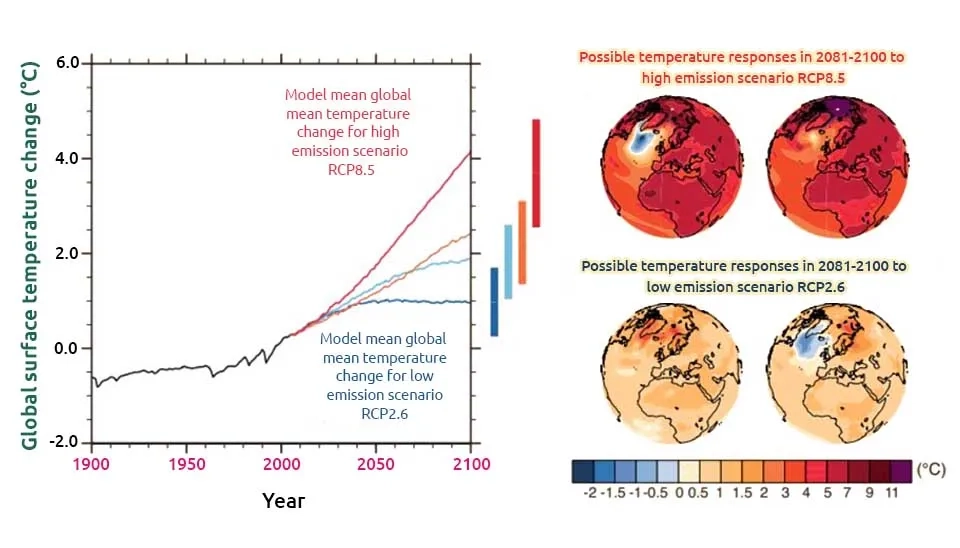
The Representative Concentration Pathways (RCPs) presented four pathways for future climate, greenhouse gas emissions, atmospheric concentrations, land use, and air pollutant emissions for the 21st century. Climate change scenarios provided by RCPs use Integrated Assessment Models (IAMs) as input to provide a range of scenarios and climate model simulations to predict their consequences for the climate system and assess the costs associated with reducing emissions. Originally, the RCP climate prediction pathways consisted of a mitigation scenario (RCP2.6), two intermediate scenarios (RCP4.5 and RCP6.0), and a critical scenario with very high greenhouse gas emissions (RCP8.5), but later RCP 1.9, RCP 3.4, and RCP 7.5 scenarios were also added to it (AR5 Physical Science Basis, 2013). A detailed description of each origin emission scenario is provided below:
RCP2.6: This scenario represents a scenario that aims to keep global temperature below 2°C above pre-industrial. According to the RCP2.6 scenario, CO2 emissions should begin to decrease in 2020 and reach zero in 2100. It is also essential that CH4 emissions be halved by 2020 and SO2 emissions reach 10% of 1980–1990 emissions. This scenario can be achieved as a result of stringent mitigation measures, the desire for renewable energy, and the increase in carbon absorption and storage technologies.
RCP4.5: The RCP4.5 scenario involves reducing greenhouse gas emissions through a combination of measures, including increasing energy efficiency and shifting to renewable energy sources. This scenario, also known as an intermediate scenario and the most likely baseline scenario without climate policies, predicts that emissions will peak around 2040 and then decline.
RCP6.0: RCP6.0 is based on an increase in emissions until about 2080 and a decrease thereafter, which would increase the global temperature by about 3–4 °C by 2100. Under this scenario, intermediate mitigation measures are carried out to strike a balance between the use of fossil fuels and the adoption of cleaner technologies.
RCP8.5: RCP8.5 describes very high greenhouse gas emissions during the 21st century, in which the use of fossil fuels continues to increase. RCP8.5 is considered the worst climate change scenario.
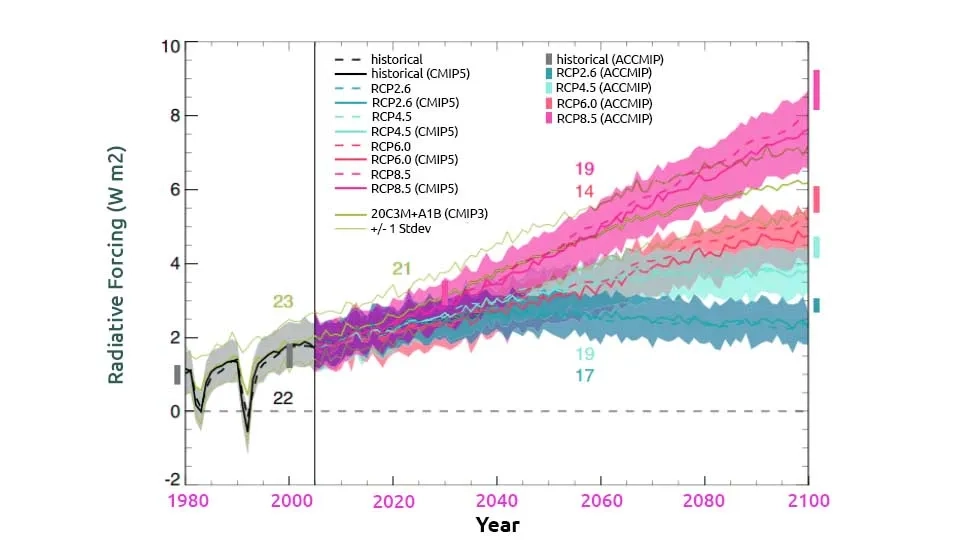
In the absence of further efforts to control emissions, pathways between RCP6.0 and RCP8.5 are more likely to describe future climate accurately. RCP climate prediction pathways have assumed that air pollutants such as Sulphur dioxide (SO2) will decrease due to air pollution control and greenhouse gas reduction policies; however, RCP land use scenarios show a wide range of possible futures. A comparison of RCPs and SRES shows that the RCPs' pathways cover a wider range than the SRES scenarios used in previous assessments; however, RCP8.5 is generally consistent with the SRES A2/A1FI scenario, RCP6.0 is close to B2, and RCP4.5 is close to B1, and for RCP2.6, there is no equivalent scenario in SRES (AR5 Physical Science Basis, 2013). RCP projections are given in five sections in the table below.
Table. Projected changes in the future climate system according to Representative Concentration Pathway (RCPs)
Air Temperature |
|
Water Cycle |
|
Ocean, Cryosphere, and Sea Level |
|
Carbon Cycle and Biogeochemistry |
|
Climate System Responses |
|
1.6. IPCC Sixth Assessment Report Scenarios: Shared Socioeconomic Pathways (SSPs), 5 Scenarios
The latest climate change scenarios published in 2021 are included in the IPCC Sixth Assessment Report, known as Shared Socioeconomic Pathways (SSPs). Shared socioeconomic pathways have less uncertainty compared to RCPs. Also, compared to previous IPCC Assessment Reports, predictions of global temperature, ocean temperature rise, and sea level rise through observations and climate sensitivity are limited. The possible range of equilibrium climate sensitivity based on several lines of evidence and the improved understanding of cloud feedback have resulted in the Shared Socioeconomic Pathways scenarios having narrower and more limited uncertainty for temperature predictions. SSPs also show uncertainties in land use changes, greenhouse gas emissions, and aerosols. The limited uncertainty leads to a more comprehensive and accurate assessment of the future climate and helps to understand the response of the climate to mitigation strategies, carbon dioxide removal, and solar radiation correction (AR6 Physical Science Basis, 2021; AR6 Synthesis Report, 2023).
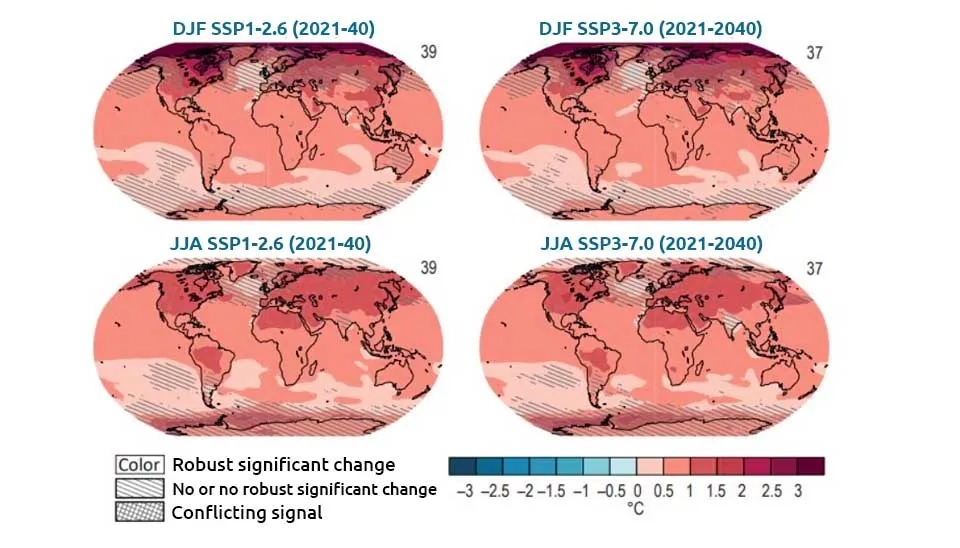
Forecasting the future temperature and climate depends on the emission of greenhouse gases, especially cumulative net CO2. Based on this, five shared socioeconomic pathway projections have been built that evaluate the amount of warming in the period 2081-2100 compared to 1850-1900: 1.4°C (1.0–1.8°C) in the very low GHG emissions scenario (SSP1–1.9), 2.7°C (2.1°C–3.5°C) in the intermediate GHG emissions scenario (SSP2–4.5) and 4.4°C (3.3°C–5.7°C) in the very high GHG emissions scenario (SSP5–8.5). A detailed description of each scenario is explained in the following:
SSP1-1.9: SSP1–1.9 represents a future in which population growth is low and many actions are taken to deal with climate change and sustainable development. As a result of equitable economic development and increased awareness through public education, a future with low emissions is predicted.
SSP1–2.6: Similar to the above scenario, SSP1–2.6 predicts slow population growth, sustainable development, and mitigation measures to deal with climate change. The realisation of this scenario requires international cooperation, effective policies, and advanced technologies with low emissions
SSP2–4.5: This scenario, which is considered the middle scenario, requires moderate efforts to deal with climate change and a balanced socio-economic development path.
SSP3–7.0: SSP3–7.0 represents regional conflicts and high competition, with scattered international cooperation and limited efforts to prevent emissions. Slow economic growth and reduction in education are predicted in this scenario.
SSP5–8.5: In the SSP5–8.5 scenario, limited efforts to address climate change, population growth, overuse of resources, and limited mitigation policies are predicted, leading to high greenhouse gas emissions and widespread climate change.
In all scenarios, an increase in global temperature is predicted in the short term. Therefore, it is necessary to implement measures such as limiting greenhouse gas emissions and net zero CO2 emissions in the short term so that global warming is limited to 1.5 to 2°C by the end of the 21st century (AR6 Physical Science Basis, 2021; AR6 Synthesis Report, 2023). Shared socioeconomic pathway projections are given in six sections in the table below.
Table. Projected changes in the future climate system according to Shared Socioeconomic Pathways (SSPs)
Temperature |
|
Precipitation |
|
Large-scale Circulation and Modes of Variability |
|
Cryosphere and Ocean |
|
Climate Response |
|
Climate Change Commitment and Change Beyond 2100 |
|
2. Conclusion
Climate change scenarios project greenhouse gases, air pollutants, aerosols, and land use in the future, leading to an accurate understanding of the future climate, assessing the impacts, and obtaining sustainable mitigation and adaptation solutions. Therefore, different levels of climate prediction scenarios have been published since three decades ago in the IPCC assessment reports. The first climate change scenario published in the IPCC First Assessment Report includes four scenarios A (Business-as-Usual), B, C, and D. All presented climate scenarios have agreed on the increase of greenhouse gas emissions and temperature rise in the 21st century; however, the presented scenarios show different levels of temperature and greenhouse gas emissions. Over the decades, the scenarios have had lower uncertainty and more certainty and have covered different aspects of climate systems, culminating in the Representative Concentration Pathways (RCPs) and Shared Socioeconomic Pathways (SSPs) scenarios. The last generation of climate change scenarios includes comprehensive predictions of temperature, precipitation, large-scale circulation and modes of variability, cryosphere and ocean, climate response, and climate change commitment and change beyond 2100. It is expected that climate change scenarios will include new aspects of the ecosystem and climate through more accurate and high-confidence projections in the future.
