A Comprehensive Training Guide to The ETo Calculator for Crop Reference Evapotranspiration
Evapotranspiration estimation is one of the first steps in many hydrological models. And also, the first step in any irrigation system design is to calculate the net water requirement.
What is reference evapotranspiration (ETo)? How will reference evapotranspiration be calculated? Where do we need reference evapotranspiration?
Evapotranspiration estimation is one of the first steps in many hydrological models. And also, the first step in any irrigation system design is to calculate the net water requirement. It is not easy to measure evapotranspiration with high accuracy. Specific devices and accurate measurements of various physical parameters or the soil water balance in lysimeters are required to determine evapotranspiration. The methods are often expensive, demanding well-trained researchers to be fully exploited in terms of accuracy of measurement. Although the methods are inappropriate for routine measurements, they remain important for the evaluation of ET (evapotranspiration) estimates obtained by more indirect methods.
One of the most reliable methods is using ET equations. ET estimation for a reference surface lets you compare this criteria in different sites around the world and use it for different crop net water calculations. One of the crop simulation models that can be used is AquaCrop. AquaCrop uses the reference evapotranspiration (ETo) as one of the input data. This data is the first step in any crop evapotranspiration and crop yield calculations.
In this Professional ETo Calculator Training, the latest available version of ETo is introduced. This model is freely available and can be downloaded.
1. Reference Evapotranspiration
Evapotranspiration (ET) is the combination of crop transpiration and soil evaporation during the growing season. Weather parameters, crop characteristics and management affect evapotranspiration. The evapotranspiration rate from a reference surface is called reference evapotranspiration and shows with ET
o
. A large, uniform grass field is considered the reference surface globally. The reference surface is a hypothetical grass reference crop with an assumed crop height of 0.12 m, a fixed surface resistance of 70 s m
-1
and an albedo of 0.23. The reference surface closely resembles an extensive surface of green, well-watered grass of uniform height, actively growing and completely shading the ground. The fixed surface resistance of 70 s m
-1
implies a moderately dry soil surface resulting from about a weekly irrigation frequency. The reference grass crop grows under optimal agronomic conditions, including disease-free and well-fertilized (
The concept of reference evapotranspiration was introduced to study the evaporative capacity of the atmosphere not related to the crop type, crop growing cycle or field management practices. At the reference evapotranspiring surface, there is no water limitation. There is a reference range for reference evapotranspiration in different climates. Typical ranges for ETo values for different agroclimatic regions are given in Table 1. These values are intended to familiarize inexperienced users with typical ranges and are not intended for direct application (Hargreaves, 1994).
Table 1. average ETo for different agro climatic regions in mm/day (Allen et al. 1998)
Regions
Mean daily temperature (°C)
Cool
~10°C
Moderate
20°C
Warm
> 30°C
Tropics and subtropics
---
---
--
humid and sub-humid
2 - 3
3 - 5
5 - 7
arid and semi-arid
2 - 4
4 - 6
6 - 8
Temperate region
humid and sub-humid
1 - 2
2 - 4
4 - 7
arid and semi-arid
1 - 3
4 - 7
6 - 9
2. Evapotranspiration Equations
According to the difficulties of obtaining accurate field measurement for ETo commonly reference evapotranspiration estimated from weather data. A large number of more or less empirical methods have been developed over the last 50 years by numerous scientists and specialists worldwide to estimate evapotranspiration from different climatic variables. These equations are needed for local calibrations and proved to have limited global validity. To help the users with different data availability, four methods were presented to calculate the reference crop evapotranspiration (ETo): the Blaney-Criddle, radiation, modified Penman and pan evaporation methods. The modified Penman method was considered to offer the best results with the minimum possible error in relation to a living grass reference crop.
The pan method as a direct measure base of ETo is expected to have an acceptable estimation. Radiation methods are suggested for areas with available cloudiness or radiation data beside temperature and sunshine. These equations have no need for wind speed and air humidity data. Finally, the publication proposed the use of the Blaney-Criddle method for areas where available climatic data cover air temperature data only (Hargreaves, 1994).
These methods were calibrated for ten-day or monthly calculations, not for daily or hourly calculations of ETo. It is suggested to use The Blaney-Criddle method for periods of one month or longer and the pan method for periods of ten days or longer. Unfortunately some users have not respected these conditions and calculations have often been done on daily time steps.
Numerous researchers analysed the performance of these four methods for different locations. Although the results of such analyses could have been influenced by site or measurement conditions or by bias in weather data collection, it became evident that the proposed methods do not behave the same way in different locations around the world. Deviations from computed to observed values were often found to exceed ranges indicated by FAO. The modified Penman was frequently found to overestimate ETo, even by up to 20% for low evaporative conditions. The other FAO recommended equations showed variable connection with the reference crop evapotranspiration standard of grass.
To evaluate the performance and accuracy of these and other equations in different climate conditions around the world, a major study undertaken by the support of the Committee on Irrigation Water Requirements of the American Society of Civil Engineers (ASCE). The ASCE study analysed the performance of 20 different methods, using detailed procedures to assess the validity of the methods compared to a set of carefully screened lysimeter data from 11 locations with variable climatic conditions.
The study proved the widely varying performance of the methods under different climatic conditions. In a parallel study commissioned by the European Community, a consortium of European research institutes evaluated the performance of various evapotranspiration methods using data from different lysimeter studies in Europe.
The results of these studies can be summarized as follows (FAO):
The Penman methods may require local calibration of the wind function to achieve satisfactory results.
The radiation methods show good results in humid climates where the aerodynamic term is relatively small, but performance in arid conditions is erratic and tends to underestimate evapotranspiration.
Temperature methods remain empirical and require local calibration in order to achieve satisfactory results. A possible exception is the 1985 Hargreaves' method, which has shown reasonable ETo results with a global validity.
Pan evapotranspiration methods clearly reflect the shortcomings of predicting crop evapotranspiration from open water evaporation. The methods are susceptible to the microclimatic conditions under which the pans are operating and the rigour of station maintenance. Their performance proves erratic.
The relatively accurate and consistent performance of the Penman-Monteith approach in both arid and humid climates has been indicated in both the ASCE and European studies
According to all the research done, the FAO Penman-Monteith method is recommended as the sole standard method. It is a method with a strong likelihood of correctly predicting ETo in a wide range of locations and climates and has provision for application in data-short situations. The use of older FAO or other reference ET methods is no longer encouraged.
3. ETo Calculator Conceptual Model
ETo Calculator as software developed by FAO, uses The FAO Penman-Monteith equation as The relatively accurate and consistent performance of the The Penman-Monteith approach in both arid and humid climates has been indicated in both the ASCE and European studies.
The equation is:
where
ETo reference evapotranspiration [mm day-1],
Rn net radiation at the crop surface [MJ m-2 day-1],
G soil heat flux density [MJ m-2 day-1],
T mean daily air temperature at 2 m height [°C],
u2 wind speed at 2 m height [m s-1],
es saturation vapour pressure [kPa],
ea actual vapour pressure [kPa],
es - ea saturation vapour pressure deficit [kPa],
D slope vapour pressure curve [kPa °C-1],
g psychrometric constant [kPa °C-1].
The reference evapotranspiration, ETo, provides a standard to which:
evapotranspiration at different periods of the year or in other regions can be compared;
Evapotranspiration of other crops can be related.
The FAO Penman-Monteith equation is a close, simple representation of the physical and physiological factors governing the evapotranspiration process. By using the FAO Penman-Monteith definition for ETo, one may calculate crop coefficients at research sites by relating the measured crop evapotranspiration (ETc) with the calculated ETo.
This equation is the base of ETo Calculator for estimating of reference evapotranspiration in your considered location.
4. Input Data
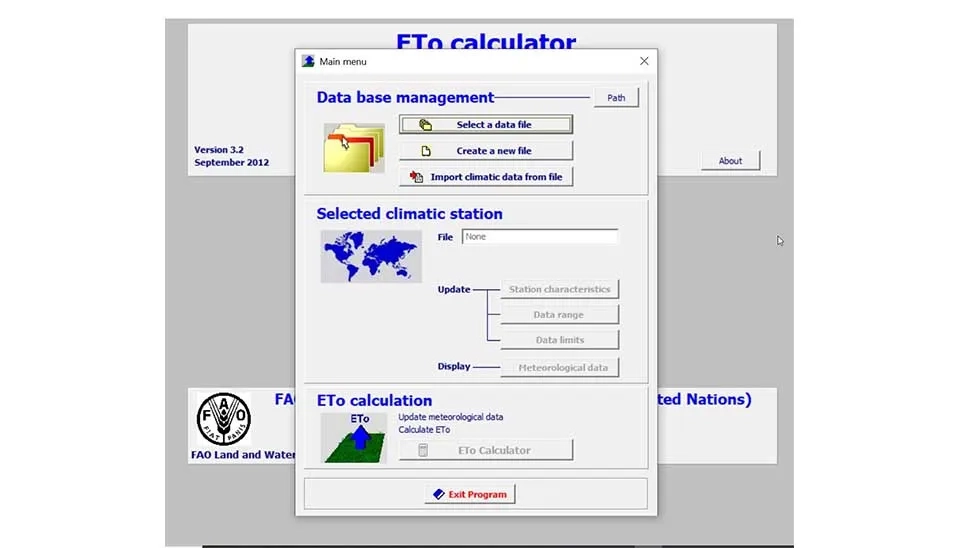
In the ETo calculator main page, you can select a station from the available default of the model, create a new data file or import your own data to estimate the ETo (Fig. 1). It is recommended to collect your data in an Excel file and use the following procedure to import them into the model. Although you can create your own data file by direct data entry in a model, which can be used for short-term calculations.
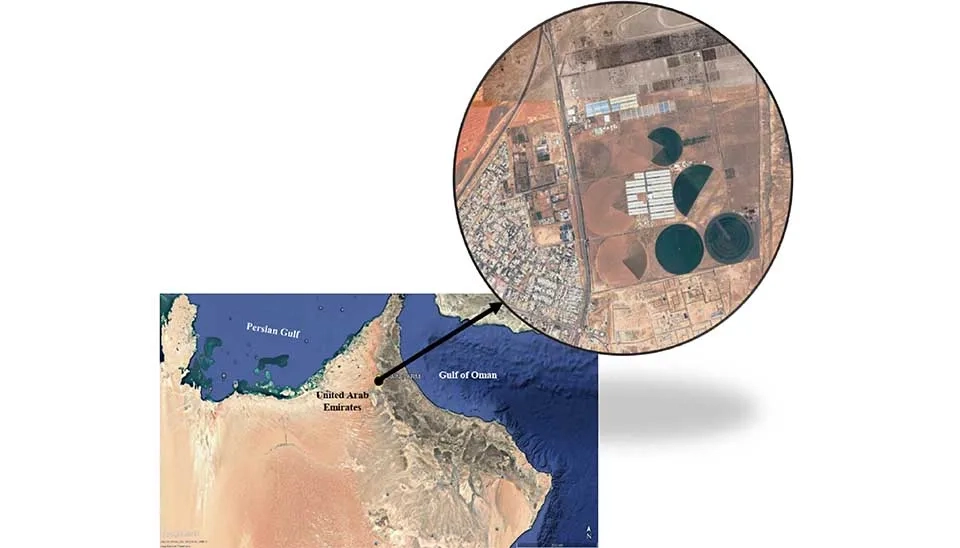
In this ETo calculator training course we use ERA5-Land data for reference evapotranspiration in a farm in the United Arab Emirates in Al-Ain State located 24° 21 '8" N and 55° 49' 37” E. This farm uses a center pivot sprinkler irrigation system for planting (Fig. 2). Pivot centers as an irrigation machine due to their specific features need accurate irrigation scheduling. The first step of this scheduling is to calculate the net water requirement and the crop evapotranspiration. The pre-calculations of reference evapotranspiration are essential in this step.
Fig. 1. The ETo Calculator main page interface within the ETo Calculator Online Training program.
The ETo calculator is a point calculation model. The calculation of the model is based on the location, longitude and latitude, altitude and range of average wind speed in the area.
In this advanced ETo calculator training we use the ERA5-Land data of our location and import them to the model by the following procedure.
Input data of this model Apart from the site location, the FAO Penman-Monteith equation requires data including air temperature, humidity, radiation and wind speed data for daily, ten-day or monthly calculations.
Fig. 2. UAE wheat farm with center pivot irrigation – a practical example in the ETo training for irrigation scheduling.
Situations might occur where data for some weather variables are missing. Even where the data set contains only maximum and minimum air temperature, it is still possible to obtain reasonable estimates of ten-day or monthly ETo with the FAO Penman-Monteith equation. Radiation data can be derived from the air temperature difference or, along with wind speed and humidity data, can be imported from a nearby weather station. Humidity data can also be estimated from the daily minimum air temperature. After evaluating the validity of the use of data from another station, ten-day or monthly estimates of ETo can be calculated. In this ETo calculator training program, the minimum and maximum daily temperature ERA5-Land data have been used for ETo calculation.
Data import in the ETo calculator can be done through 3 file types:
Free format text files (files with extension CXT);
FAO Clim 2 files (files with extension DAT);
CLIMWAT files (files with extension PEN).
Clim 2 and CLIMEWAT are two weather data banks developed by FAO. that let you import the data directly to the ETo calculator models. In this Training on ETo Calculator, we import the ERA5-Land data by using a CXT format to the model.
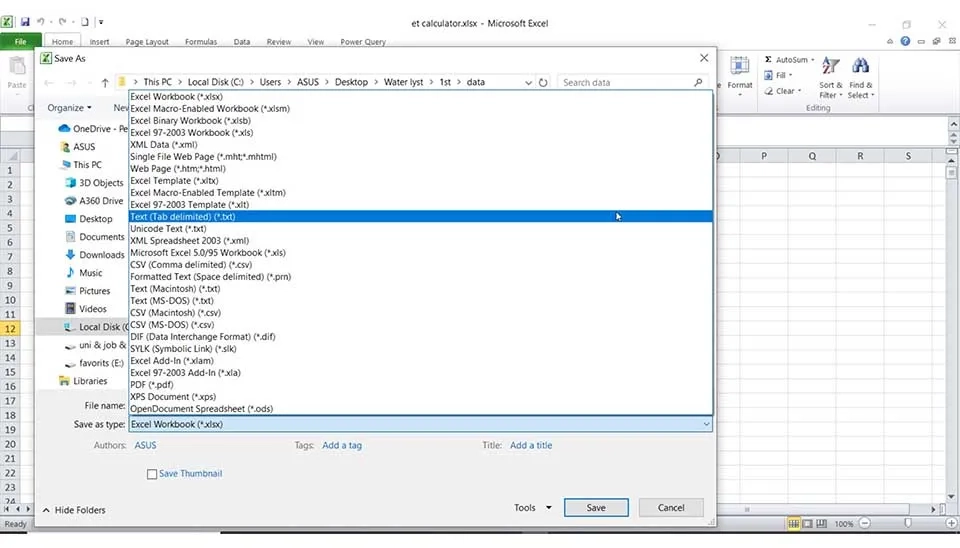
For creating a CXT file, the first step is to create an Excel file containing the uniformed data in columns without any header and in a specific period of time. The missing data should not be blank and the value ‘-999’ should be specified.
After creating the Excel file, the first step is to save the file as 'Tab-delimited' text format, as it shows in Fig. 3.
Fig. 3. Preparing data for ETo Calculator import: Saving as Tab-delimited text in Excel.
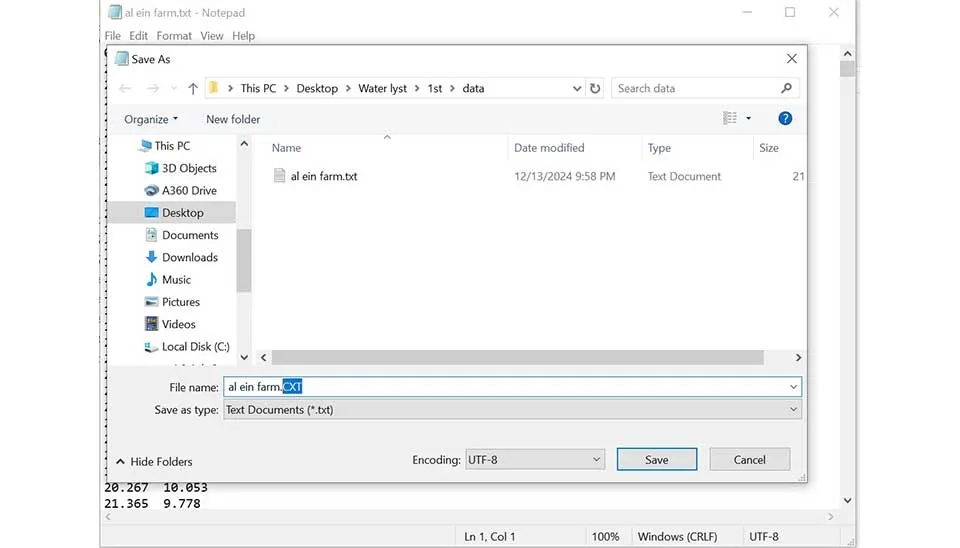
After saving the data in a text file, the format of the file should be changed to CXT. For this, open the file with text-based software like Notepad and save the file by adding '.CXT' to the end of your file name, as it shows in Fig. 4.
This process is one of the simplest ways to create a text base file in the specific format to enter the data in different software and models. After this step, the needed CXT is ready to import to the model.
Fig. 4. Changing the text file format to CXT using Notepad in ETo training.
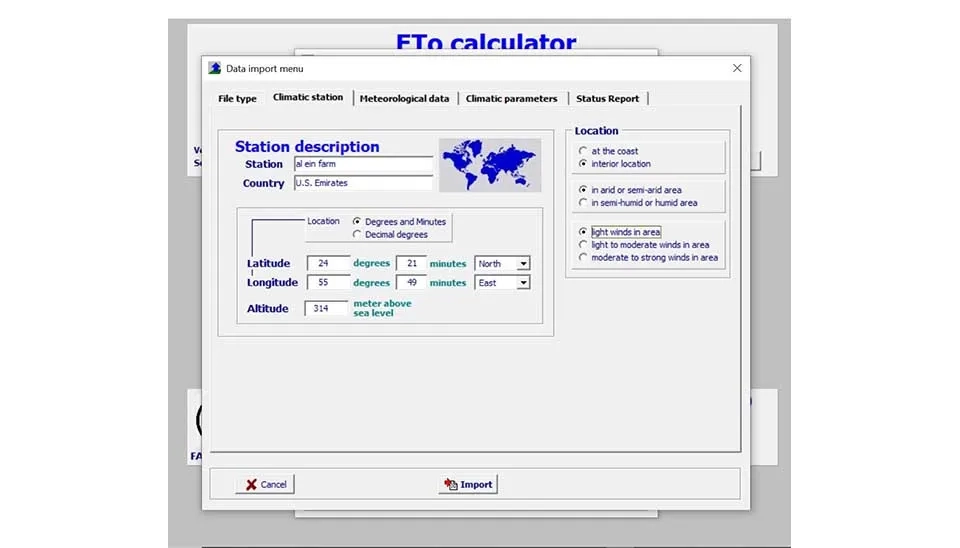
In the import data main window, in the first tab, introduce the location of your CXT file. The second tab of this window should be filled with the climate station characteristics (Fig. 5). Latitude and longitude of the location of the weather station should be entered by the accuracy of minute and altitude should be in meters.
Coastal locations should be introduced to the model separately. Our location is in the interior of the land and it is not a coastal location. The general climate of the location should be considered in this step. And as the final characteristics of your climate station, the average wind speed should be specified. These explanations are used for calculating the missing data. There are some default values linked to these characteristics, which can be changed by the model user.
Fig. 5. Climate station sub window for defining location characteristics in ETo Calculator.
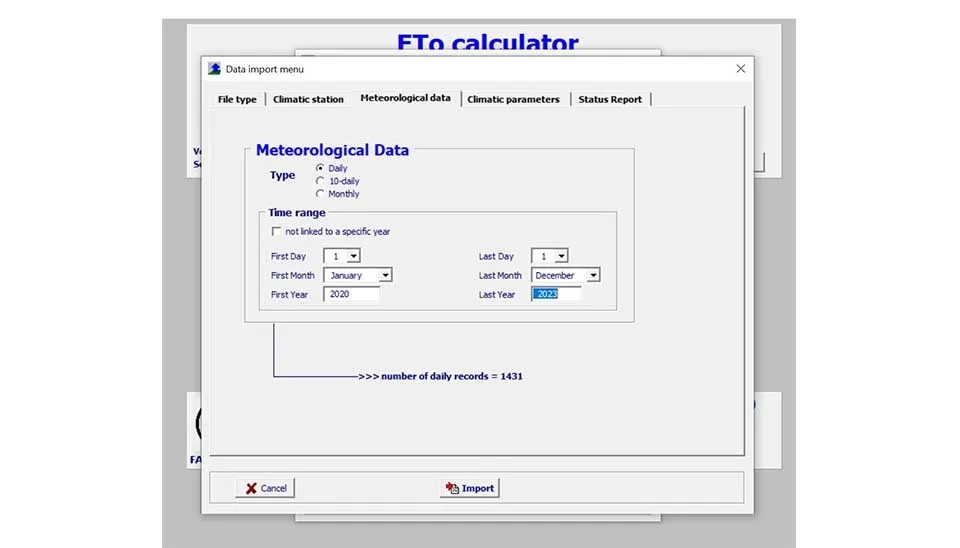
In the meteorological tab, the type and the time range of imported data should be introduced to the model. The type of data can be daily, ten- days or monthly. This model cannot calculate the reference evapotranspiration (ETo) in a smaller time step than daily, like hourly of six hours. The type of your output data depends on the entry data type so if you need a daily output, the entered data should be of the daily type. The time range of data should be compatible with the number of data points in your imported file.
Fig. 6. Meteorological tab in the data import window: Specifying data type and time range.
There is an option for calculating reference evapotranspiration independent from the specific time. These data are more used in comparing the potential of ETo in different locations and for crop simulation models, it is recommended to use the time range data, especially in climate change adaptation research.
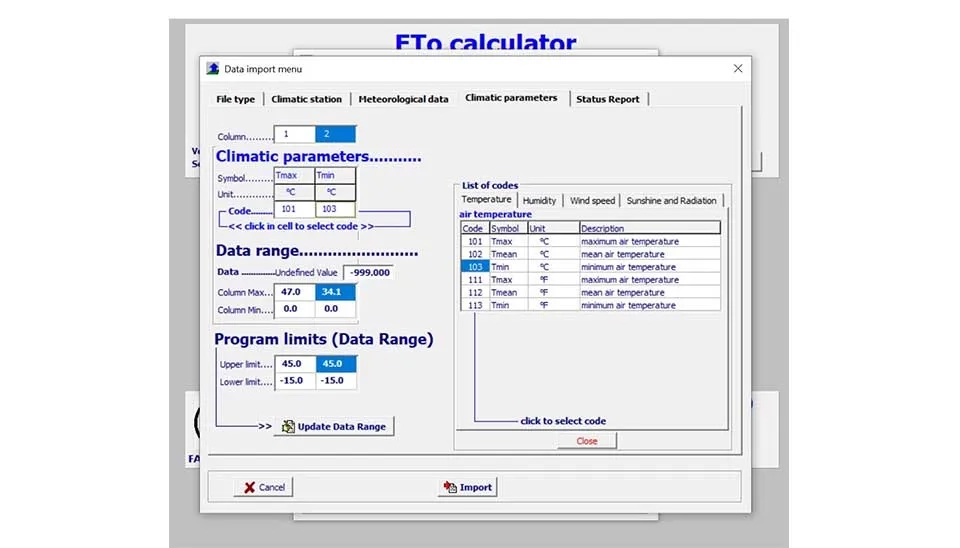
In the climatic tab of the import data window, type and unit of imported parameters should be specified. The number of the columns shown is related to the columns in your imported CXT file.
Fig. 7. Climatic parameters tab for defining data types and units in ETo Calculator import.
For each column, choose the correct type and unit from the list of codes available in the right of the window. The data range shows the maximum and minimum of your entered data and the program limits show the default model value for upper and lower limits of the chosen code. These two ranges should be exactly the same to provide any error in the next step. By pressing the update data range button, these default values will be updated with your data range.
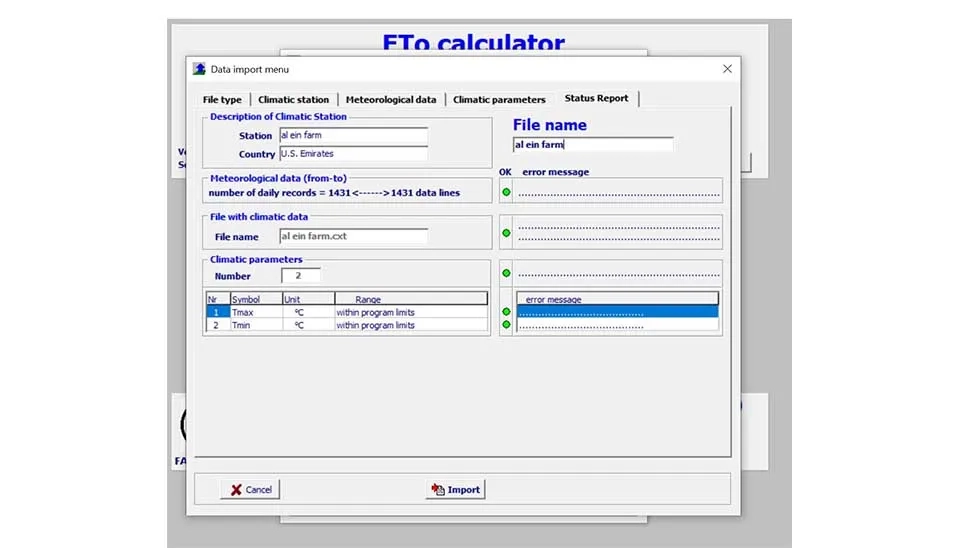
In the status report tab the error of your file shows. If there will be a difference in count of data due to your specified time range or difference in value range of data, there will be a red circle in front of the line.
Fig. 8. Status report tab showing data import status and error indicators in ETo Calculator.
Green circles, as it shows in Fig. 8, mean that the data entry is completed in the correct way and by pressing the import button, your climate file will be created.
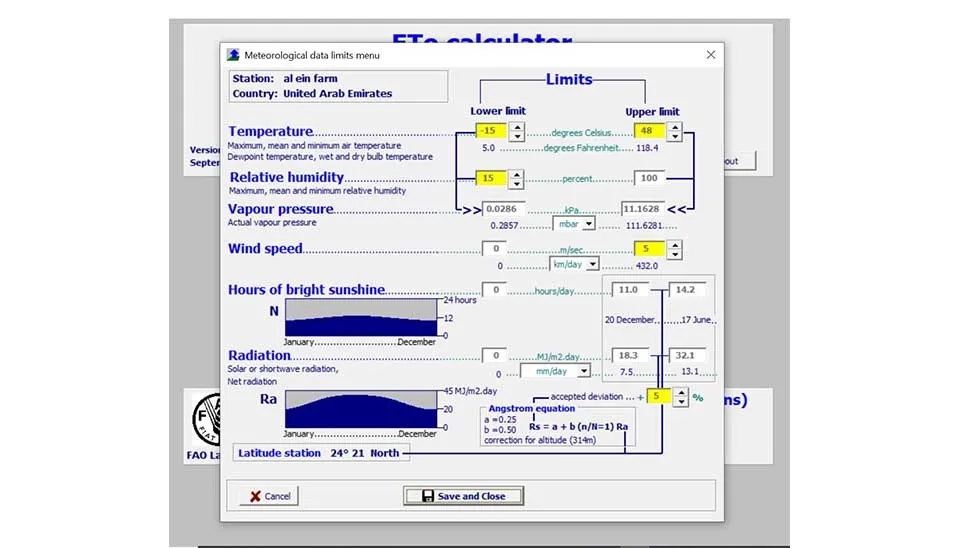
After import and creation of your climate file, you will be back to the main menu of ETo calculator (Fig. 1). In this step, you can check the entered data by using the meteorological data limits subwindow (Fig. 9). Yellow items drive from user entered data and can be changed in this step. The wind speed value goes back to the station characteristics considered in the climate station tab and the default value can be changed through your real data. This option is used on occasion when there is no available time series for one parameter but the average value of parameters in the area is available. This adjustment decreases the error in the reference evapotranspiration calculation.
Fig. 9. Meteorological data limits sub window for reviewing and adjusting imported data in ETo Calculator.
5. Output Data
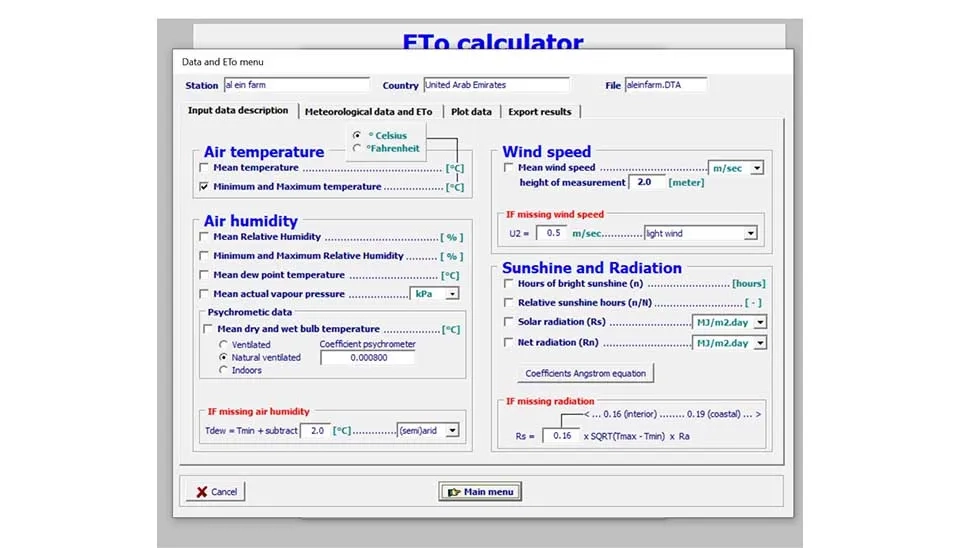
The ETo calculator button runs the model for the selected climate station. After the model runs a new window will be opened as it shows in Fig. 10. If you forget to check the entered data before the model runs, this window summarizes the input data in the input data description tab.
Fig. 10. Output data window displaying ETo calculation results in the Comprehensive Guide of ETo Calculator.
You can even do some calibration in this step by changing the unit or default value for missing data. Any changes in this tab affected the result in the following tab at the moment.
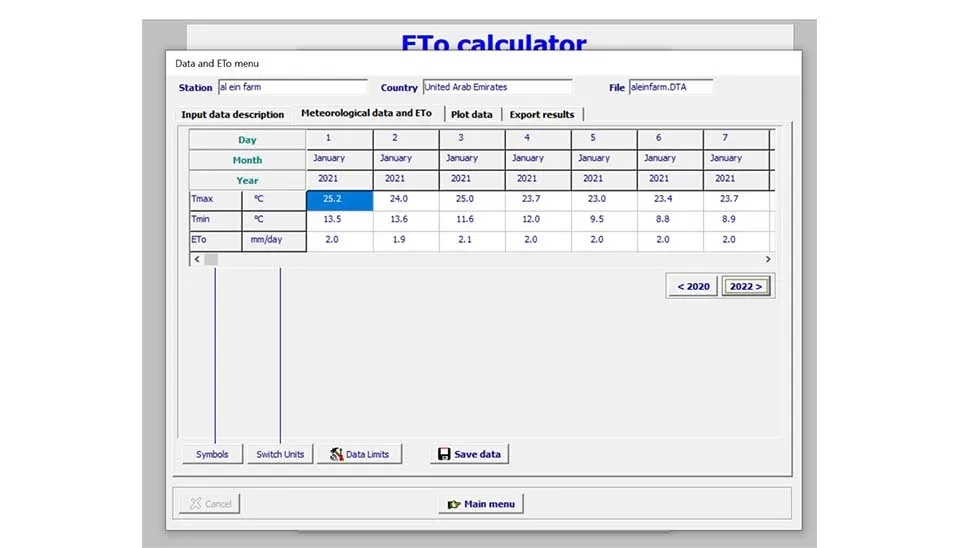
In the meteorological data and ETo tab, the input data and calculated ETo are shown in the table version according to Fig. 11.
Fig. 11. Displaying data in the ETo Calculator: The Meteorological data & ETo tab
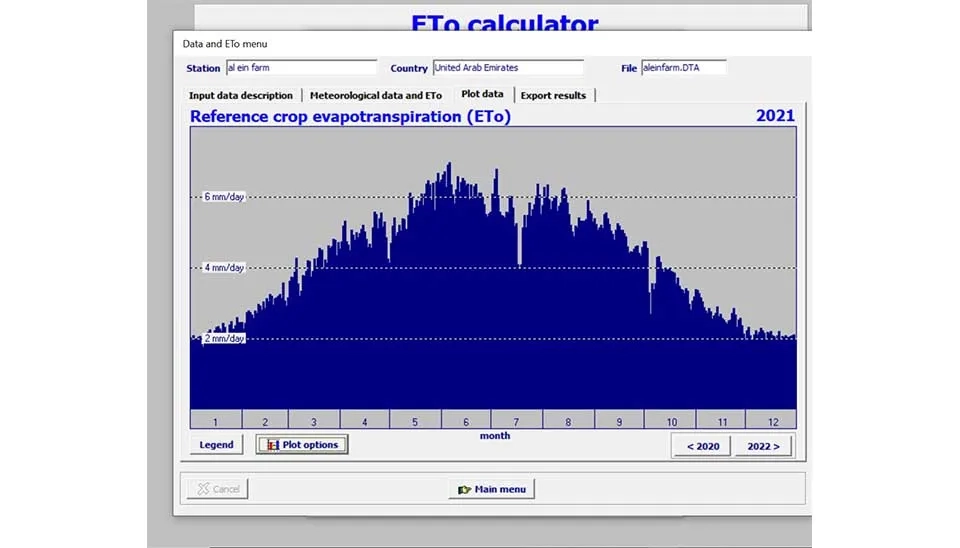
In the plot data tab, the graphical results of the model will be shown (Fig. 11). In this tab, you can find the maximum reference evapotranspiration in your considered location and check the range with the value of Table 1 to evaluate the accuracy of model results.
Fig. 12. Plot data window displaying graphical ETo results and maximum value in the ETo Calculator.
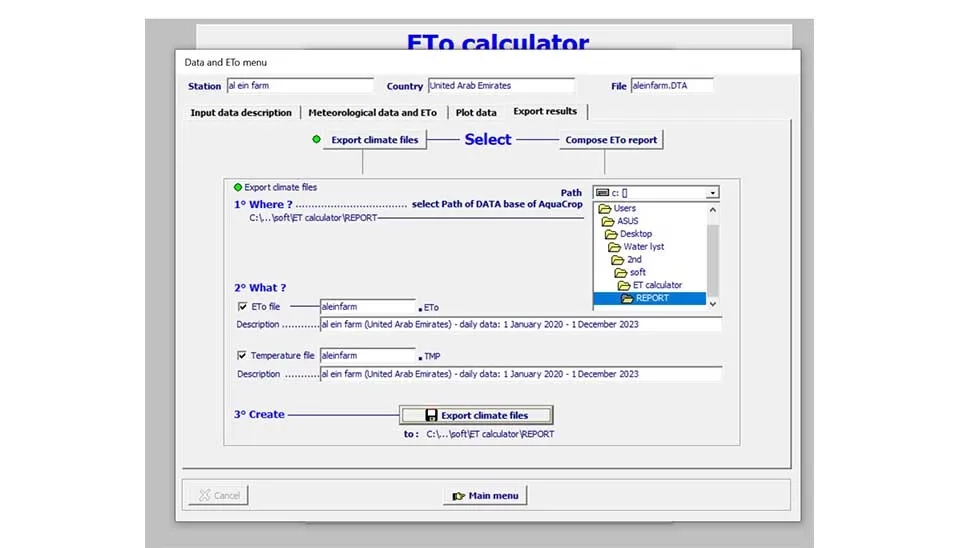
The Export tab lets you export the data or create a report from model results. Exporting climate files (Fig. 13) includes ETo and temperature files that can be used as input data for other linked models, such as the AquaCrop model.
Fig. 13. Export results window for output data and report generation in the ETo Calculator
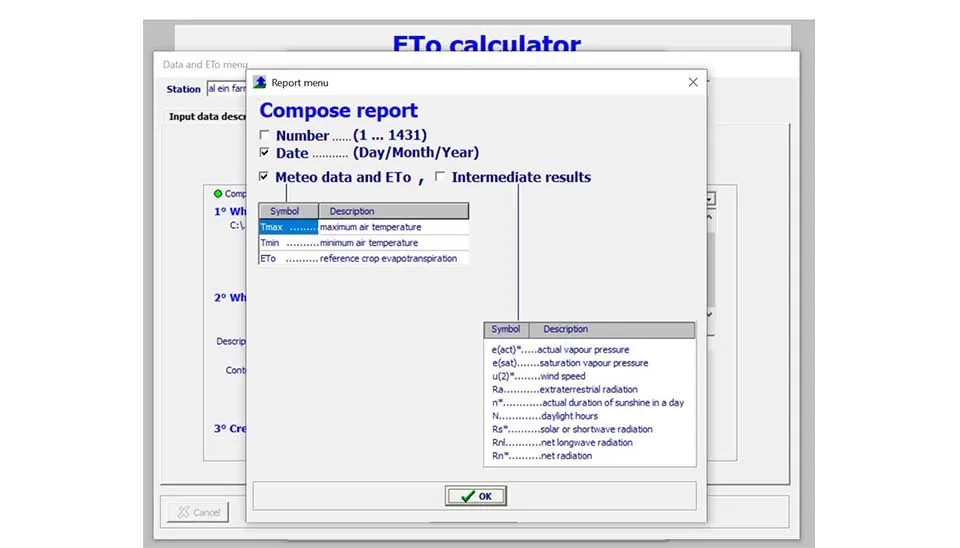
The Compose ETo report button lets the users create a personalized report consisting of input and output data and all intermediate data calculated by model (Fig. 14). The list of these intermediates shows in the box. The report will be saved in the REPORT file of the model location and the format is REP. You can use any text-based software, such as Notepad, to open the file or move to other software, like Microsoft Excel, to use the data.
Fig. 14. Report menu window for customizing and generating detailed reports in the ETo Calculator.
6. Conclusion
The ETo calculator model lets users calculate the reference evapotranspiration in different locations and stations simply. The method used in this model is the FAO-Penman-Monteith equation, which has the most accurate estimations with real data according to the research and publications. The result of this model can be used as an input for other FAO developed models such as AquaCrop. The ETo calculation could be used for meteorology research or in hydrological models as a reference check point and entry data. ETo calculator model can be linked to other FAO climate data bases or any satellite derived data in daily, ten-days or monthly time steps. Farmers and engineers are the practical users of this model. This model can be used for any climate change assessment in climate data, crop simulation models and water productivity research.


Comments
No comments yet
Be the first to comment
Share your thoughts and start the conversation.