
How can you continuously evaluate and monitor the quality of an area of 361,740,000 square kilometers? 361,740,000 square kilometers is the area of water on the surface of the earth and is equivalent to 71% of the surface of the earth, and the quality here is the quality of water. To this vast scope, add the challenges associated with the analysis of water quality indicators. The only answer is definitely remote sensing.
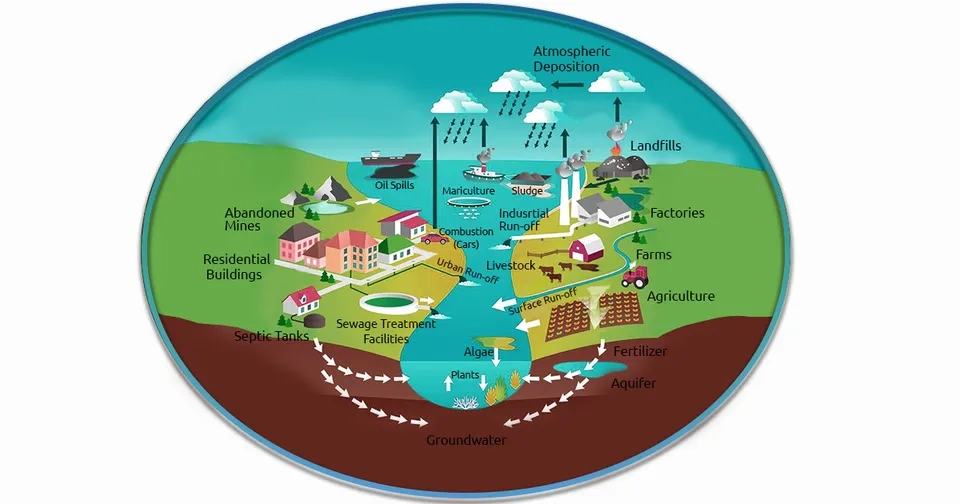
Today, a significant part of water resources are at risk of pollution. According to the World Health Organization (WHO) report, 1.7 billion people use drinking water contaminated with microbial pollution in 2022. In addition to microbial pollution, the emergence and spread of chemical pollutants such as pesticides, drugs, microplastics, etc. has worried people more than before (WHO, 2023). In addition to human health, water pollution endangers the health of ecosystems and biodiversity and affects the economy and growth of societies. Knowing the polluting sources originating from industrial applications, agricultural practices, and urban development, as well as water pollution monitoring to evaluate water quality on a local, regional, and global scale will lead to sustainable development (Akhtar et al., 2021).
Table 1. Relative comparison of water quality monitoring with remote sensing and in situ data
In Situ Water Quality | Remote Sensing in Water Quality |
Time-consuming and expensive | Monitoring an entire water resource (not a point) |
Point estimates of water quality assessment | Extensive temporal and spatial comparison coverage |
Inefficient on a large spatial scale and vast water resources | Comparison between the quality of water resources of a region with each other |
Weakness in inaccessible water resources | The historical record of past quality and its change process |
Laboratory error and field sampling error | High-accuracy interpolation |
Systematic Water Management (SWM) and Water Quality Monitoring Programs (WQMPs) require a reliable evaluation of water resources quality and their continuous monitoring so that decision-makers can obtain management strategies using accurate information on water quality. Therefore, extensive studies on water quality monitoring methods and their challenges have been underway since 1940. The conventional method used in the early decades was in situ data, sampling, field, and laboratory measurement. However, the development of remote sensing methods has made it possible for long-term and large-scale oversight, which has been welcomed by researchers in recent years (Behmel et al., 2016; Wang and Yang, 2019).

1. Water Quality Assessment and Monitoring
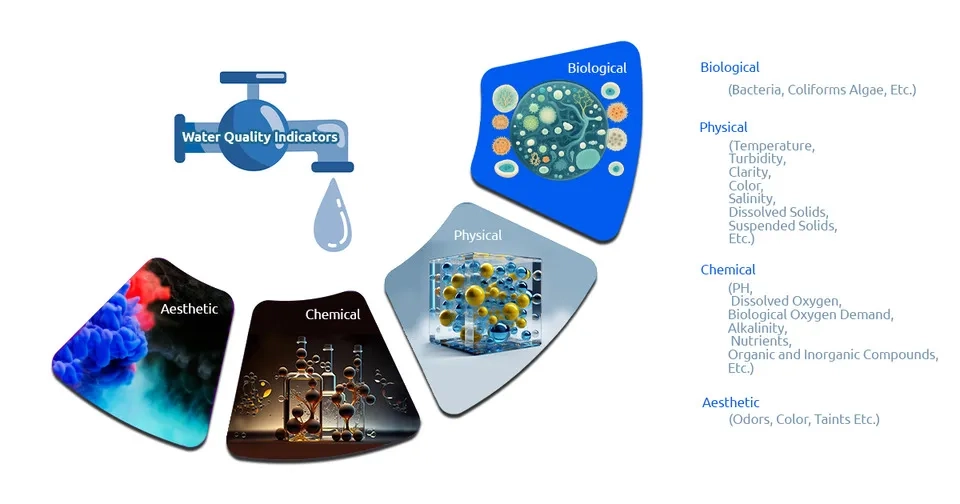
Water quality consists of physical, chemical, and biological characteristics of water resources and the investigation of pollution sources and their spread that affect water quality. Many natural and human factors (mainly human factors) cause a decrease in the quality of water resources, such as pesticides, sewage and waste discharge, heavy metals, sediments, and microorganisms. Therefore, standards have been introduced to help preserve these precious resources by specifying the permissible limit of pollution. The standards used water quality indicators that distinguish between polluted water resources and non-polluted water resources. Water quality indicators are divided into four categories:
1) Biological (bacteria, coliforms algae, etc.)
2) Physical (temperature, turbidity, clarity, color, salinity, dissolved solids, suspended solids, etc.)
3) Chemical (pH, dissolved oxygen, biological oxygen demand, alkalinity, nutrients, organic and inorganic compounds, etc.)
4) Aesthetic (odors, color, taints etc.)
(Lakshmi et al., 2023; Usali and Ismail, 2010).
Next, we will examine the applications of remote sensing in each of the water quality indicators.
2. Applications of Remote Sensing in Water Quality
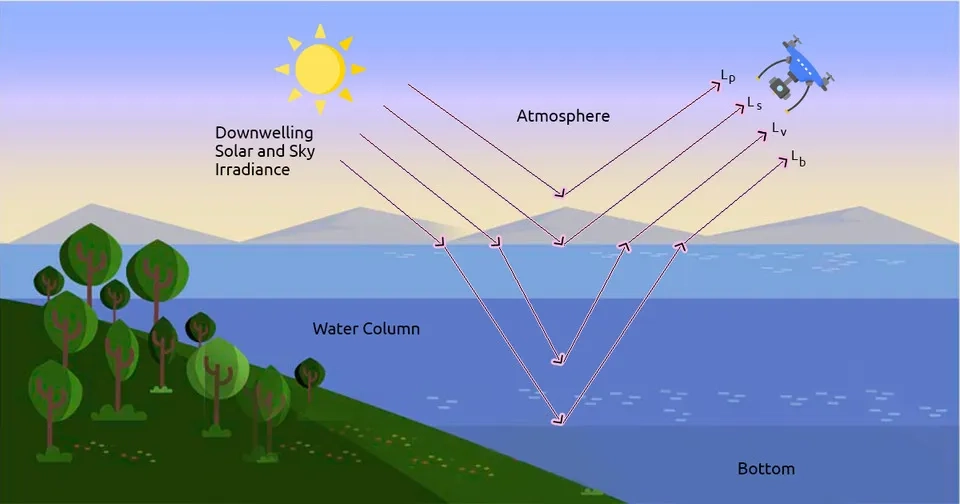
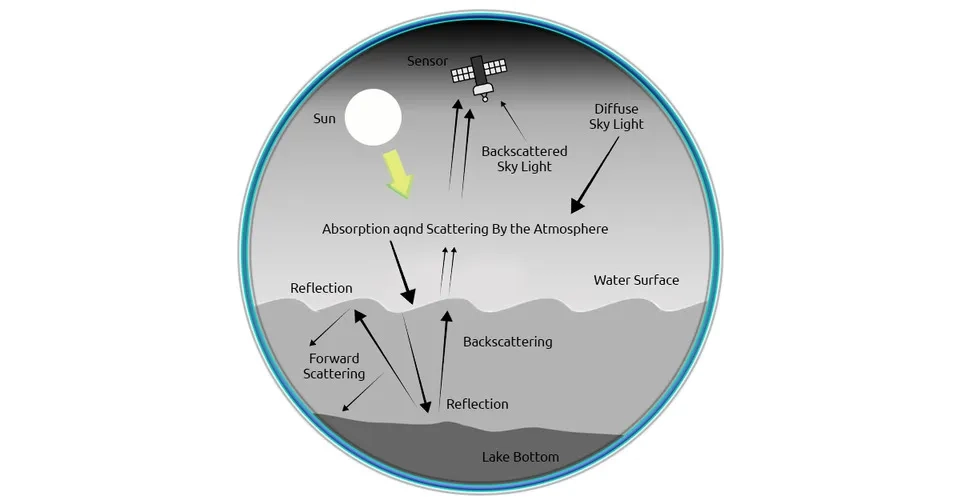
In the past, in situ data was used for water quality monitoring. Conventional methods based on in situ data were only able to provide point information on water quality and therefore, faced challenges and limitations (Table 1). To solve these challenges, since the early 1970s, methods based on remote sensing for water quality assessment and monitoring were invented and presented. In the methods based on remote sensing in water quality monitoring, the use of the visible and near-infrared bands of the solar spectrum is mainly used in order to establish a relationship between reflection and physical, chemical, and biological characteristics related to water quality by using experimental relationships. Despite the advantages of remote sensing in water quality, a more accurate evaluation and monitoring of the water quality of water resources requires the combination of field and in situ methods with remote sensing for calibration and verification (Ritchie et al. 2003; Gholizadeh et al., 2016). Applications of remote sensing in water quality monitoring and assessment are divided into three indices of water quality:
1) Physical indices,
2) Chemical indices, and
3) Microbiological indices, which are discussed in the following.
2.1. Physical Indices
The physical characteristics of water quality represent temperature, salinity, turbidity, and suspended sediments, which are independent of the nature and chemistry of water. Applications of remote sensing in the analysis of physical indicators of water quality are given below.
2.1.1. Water Surface Temperature
Temperature is one of the quality characteristics of water that affects physical, chemical, and biological processes. Also, water temperature has a fundamental role in other water quality characteristics such as solubility, dissolved oxygen, and transport of nutrients. Thermal infrared bands can estimate infrared radiant emitted and monitor water surface temperature. However, in the months of the year when water sources are stratified or in rivers, the water temperature monitor faces challenges, but in general, remote sensing is widely used to measure water surface temperature. Thermal-infrared images and thermal radiation detection sensors emitted from the upper 0.1 mm of the water surface have a reliable spatial and temporal distribution of the water surface temperature. Thermal-infrared imaging sensors have multiple spectral bands at different wavelengths that make them efficient for measuring water temperature (Haakstad et al., 1994; Jiang et al., 2021).
2.1.2. Surface Salinity
Water salinity affects density and density affects flow. Therefore, salinity is one of the quality parameters of waters that directly affect the currents and circulation of oceans and seas and indirectly affect the water balance and evaporation. Remote sensing sensors are able to estimate the salinity of the water surface by passive microwave radiometers. However, passive microwave radiometers depend on long wavelengths (20–30 cm) and a large antenna, which most satellites lack, but new interferometric technology has made it possible to measure salinity. Meanwhile, the airborne Scanning Low-Frequency Microwave Radiometer (SLFMR), Aquarius, Electronically Scanned Thinned Array Radiometer (ESTAR), and Soil Moisture and Ocean Salinity (SMOS) are widely used in surface salinity measurement (Klemas, 2011).
2.1.3. Total Suspended Sediment and Turbidity
Total suspended sediments are one of the quality characteristics that affect other water quality parameters; On the one hand, the increase of suspended sediments in water bodies causes obstruction and reduction of light penetration, reduction of dissolved oxygen, change of nutrients, and blockage of the channel. On the other hand, suspended sediments play a role in the discharge and movement of sediments and in general in the dynamics of the river. Therefore, it is necessary to constantly assess and monitor the amount of suspended sediments in water resources (Peterson et al., 2018)
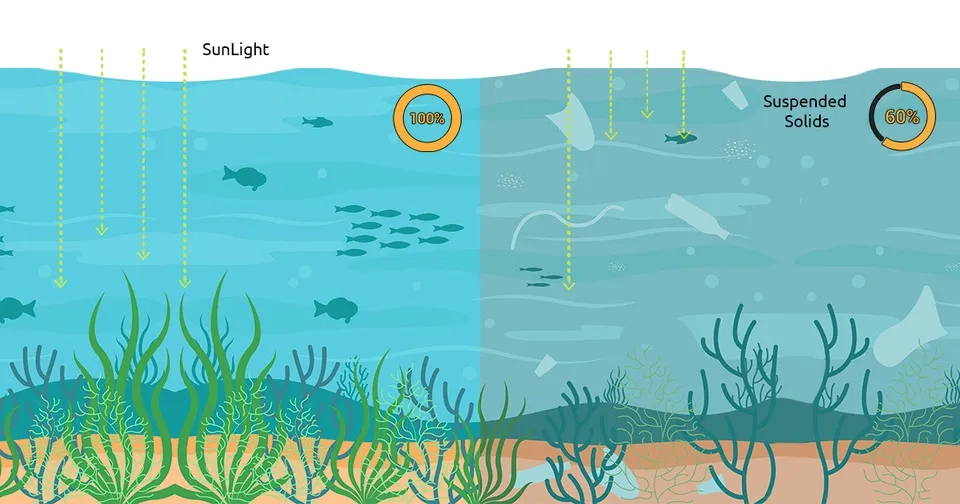
Suspended sediments increase turbidity, so that, the turbidity monitor is used to analyze suspended sediments and vice versa. The increase of suspended sediments and turbidity increases the reflection of red and Near-Infrared (NIR) bands of the electromagnetic spectrum, and this feature is used to monitor suspended sediments and turbidity through remote sensing. In addition to red and NIR single bands, the increase of suspended sediments and turbidity affects the ratio of other bands as well. Red bands of Landsat Thematic Mapper (Landsat TM, 630-690 nm), Satellite Pour l'Observation de la Terre (SPOT, 610-680 nm) sensors, and Moderate Resolution Imaging Spectroradiometer (MODIS, 645 nm) are able to monitor low turbidity (0.9-15 Nephelometric Turbidity Units (NTU)). Medium Resolution Imaging Spectrometer (MERIS) dataset (681 nm) and Landsat dataset are also used for medium turbidity (1-25 NTU) and high turbidity (2–997 NTU), respectively. In general, the best range of reflectance for identifying and monitoring total suspended sediment is the spectral range of 580-680 nm and 700-900 nm (Ruegner et al., 2013; Chawla et al., 2020).
2.1.4. Secchi Disk Depth
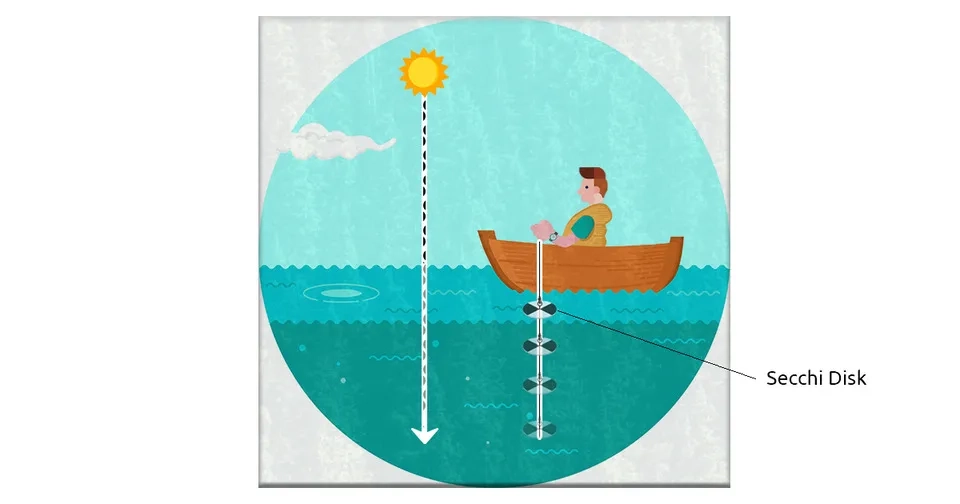
Secchi disk depth is one of the quality characteristics of water and represents its level of transparency and clarity. In the past, a black and white disk with a radius of 30 to 100 cm, called a Secchi disk, was placed in the water and the depth at which the disk could no longer be seen was defined as the Secchi disk depth (Davies‐Colley and Smith, 2001). An indirect way to determine Secchi disk depth is to use the empirical relationships between Secchi disk depth and turbidity and total suspended sediments since Secchi disk depth has an inverse relationship with turbidity and total suspended particles. The second way is to use spectral bands and red and blue bands or the ratio between different spectral bands through remote sensing to determine Secchi disk depth, which is more efficient and convenient than the on-site method (Lathrop, 1992; Zhang et al., 2022).
2.2. Chemical Indices
Chemical indicators of water quality depend on the nature of water (as a solvent) and dissolved substances (oxygen, nitrogen, phosphorus, etc.) that remote sensing has been able to monitor. The most important and practical chemical indices, which are monitored by remote sensing, are discussed below:
2.2.1. Dissolved Oxygen, Biochemical Oxygen Demand, and Chemical Oxygen Demand
Dissolved oxygen (DO) is one of the qualitative characteristics of water that is changed by human and natural factors and affects the life of aquatic organisms that need oxygen. Biochemical Oxygen Demand (BOD) is the amount of oxygen required for bacteria to decompose organic matter under aerobic conditions. Releasing wastewater with BOD levels facilitates the growth of bacteria and reduces the oxygen concentration of water. Chemical Oxygen Demand (COD) is the amount of substance required to be oxidized, which is measured chemically. The measurement of DO, COD, and BOD with remote sensing faces challenges that have caused the results of remote sensing of DO, COD, and BOD to have high uncertainty and less reliability. However, experimental methods have been developed to partially identify the relationship between reflectance and water physicochemical parameters and the ratio between the bands. Among the sensors and satellites, Landsat TM has been used more than other sensors to monitor DO, COD, and BOD, however, more studies are needed for more accurate assessment (Gholizadeh et al., 2016).
2.2.2. Colored Dissolved Organic Matter
Colored Dissolved Organic Matter (CDOM) is obtained from sediment loading, algal growth, bacterial activity, and plant decomposition and consists of macromolecules with aromatic, fulvic, humic, and carboxylic acids. The high concentration of CDOM affects the physical, chemical, and biological properties, prevents the penetration of light in the water depth, causes the growth of phytoplanktons, intensifies eutrophication, and changes the water color to yellow-brown (Branco and Kremer, 2005; Twardowski and Donaghay, 2001; Stedmon et al., 2011). Hence, it is necessary to continuously monitor the concentration of CDOM, which is used by remote sensing to monitor it.
In remote sensing-based methods, past studies have used visible spectral bands and ultraviolet and blue-green bands to monitor CDOM. The high concentration of suspended solids and chlorophyll in water makes CDOM monitoring challenging. Nevertheless, hyperspectral remote sensing data for water quality evaluation are an efficient tool for more precise monitoring of CDOM (Brezonik et al., 2005).
2.2.3. Total Nitrogen and Phosphorus
Increasing the concentration of total nitrogen and phosphorus in water bodies accelerates the growth of plants and algae. Sewage effluents and agricultural fertilizers are the main sources of phosphorus and nitrogen in water. Phosphorus in water is organic, inorganic, and soluble and is estimated directly and indirectly from chlorophyll concentration, transparency, and Secchi depth. The correlation of phosphorus concentration with optically active constituents has caused remote sensing to be used to analyze total phosphorus concentration. Meanwhile, multispectral Landsat TM data and hyperspectral remote sensing are powerful tools for monitoring total nitrogen and phosphorus in water resources due to wide temporal and spatial coverage (Swanson and Zurawell, 2006).
2.3. Microbiological Indices
Microbiological indicators of water quality consist of chlorophyll concentration, Escherichia coli (E. coli), fecal coliforms, etc. (Uddin et al., 2021). Major applications of remote sensing in microbiological indicators are limited to chlorophyll monitor.
2.3.1. Chlorophyll–a
Chlorophyll-a is one of the quality characteristics of water, which indicates the amount of photosynthesis pigment. Since the function of chlorophyll is to create green color in algae and plants, it is able to reflect green wavelengths and absorb other wavelengths. The importance of chlorophyll in water resources is due to the identification of eutrophication and algal bloom, and therefore many studies have investigated the applications of remote sensing in water quality for estimating chlorophyll in water resources. In fact, the release of agricultural fertilizers and burning of fossil fuels introduces significant amounts of nitrogen, phosphorus, and nutrients into water resources, accelerates the growth of algae, and increases eutrophication in an unnatural way (Li and Li, 2004).Identification of chlorophyll in water bodies using remote sensing is through spectral reflectance curve; In this way, chlorophyll in water causes absorption in the blue (0.4 µm) and red (0.7 µm) bands, and reflection in the green (0.5 µm) and near-infrared (0.8 µm) bands and affects the spectral reflectance curve. The presence of suspended sediments in water causes errors in the detection of chlorophyll concentration, therefore it is recommended to use narrow bandwidth imagery with optimum bandwidth to approximately 675 nm and 700 nm in water resources contaminated with high concentrations of suspended sediments. In relation to remote sensing, Landsat TM and Enhanced Thematic Mapper Plus (ETM+) satellite sensors are widely used to identify chlorophyll concentration due to their free and wide temporal and spatial coverage ( Härmä et al., 2001).
3. Overview of Remote Sensing Data in Water Quality Assessment and Monitoring
In sector 2, the applications of remote sensing in water quality monitoring were investigated. In general, remote sensing data are divided into satellite and non-satellite remote sensing for water quality monitoring (Yang et al., 2022), which are discussed in the following:
3.1. Satellite Remote Sensing Data for Water Quality Evaluation
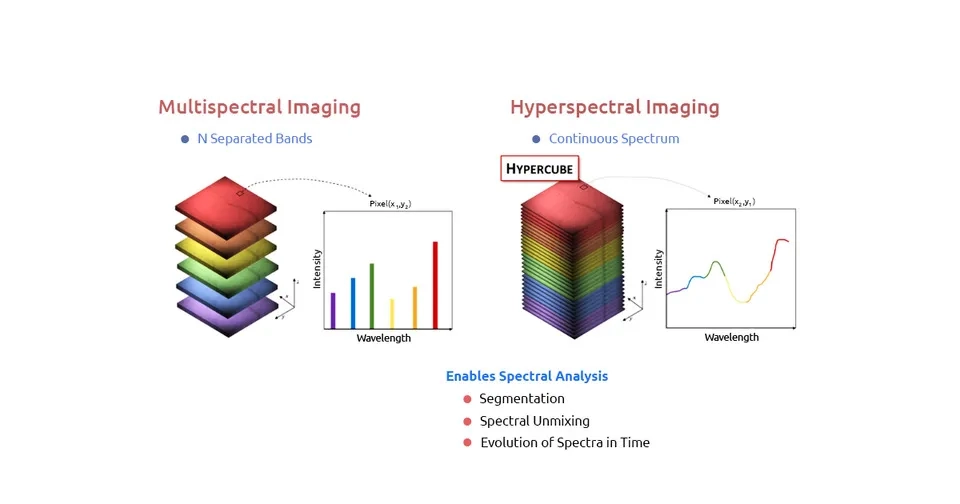
Satellite remote sensing for water quality monitoring is divided into two categories based on continuous or separate bands and spectrum: Multispectral and hyperspectral data (Fig. 7), which are explained below:
3.1.1. Multispectral Data
Multispectral data are widely used to measure water quality, including Mobile-Satellite Service (MSS), Thematic Mapper (TM), ETM+, Operational Land Imager (OLI), European Space Agency (ESA) Sentinel-2, Environmental Satellite Satellite (ENVISAT), MERIS, SPOT, and Advanced Very High Resolution Radiometer (AVHRR) of NOAA. Meanwhile, Landsat data is more capable of estimating water quality parameters than others due to its easy access and high spectral, spatial, and temporal resolution, and therefore it is more common and widely used than other multispectral data. These data and models are made with experimental methods and can be used for a specific area in a specific period (Batur and Maktav, 2018; Odermatt et al., 2018).
3.1.2. Hyperspectral Data
Hyperspectral satellite data such as Hyperion data and Hyperspectral Imager (HIS) data of Huan Jing (HJ-1) satellite have multiple bands and a high spatial resolution (0.01 μm). High spectral resolution and many bands make hyperspectral data accurately and optimally source as remote sensing data for water quality evaluation (Cao et al., 2018; Kudela et al., 2015)
3.2. Non-Satellite Remote Sensing Data for Water Quality Evaluation
Non-satellite data consisting of airborne and ground-measured spectral data have been used to measure water quality in recent years. The development of unmanned aerial vehicles with multi-spectral cameras, spectrometers, infrared sensors, and Lidar has provided the possibility of water quality monitoring, however, high cost and limited spatial scale coverage are associated with weaknesses and challenges of non-satellite remote sensing data in water quality assessment (Ouma et al., 2018).
4. Remote Sensing Modelling Approaches in Water Quality
Remote Sensing Modeling water quality refers to the relationship between optical qualities and concentration of optically active, which are divided into three categories: empirical, semi-analytical, or machine learning. The most common models for measuring water quality are empirical models, which, despite their simplicity and low computational cost, cannot be generalized in terms of time and space. However, in recent years, due to the development of computing power and available data, researchers have paid special attention to machine learning models, but these models work similarly to experimental models. Semi-analytical models also measure water quality based on inherent optical properties and governing physics. Each of the remote sensing modeling approaches has its advantages and capabilities, which can be used depending on the type of water quality parameter (Topp et al., 2020).
5. Conclusion
The increase in population, the expansion of urbanization, and the development of agriculture and industries introduce a significant amount of pollutants into water sources, which endangers human health, ecosystems, and biodiversity. Therefore, the importance of water quality assessment and monitoring is obvious. In the past, in situ data and methods were used to monitor water quality, but due to the high cost and time-consuming, remote sensing methods gradually replaced them. Nowadays, remote sensing is used in all aspects of water quality. In this article, the applications of remote sensing in water quality were investigated from three perspectives: physical (water temperature, salinity, total suspended sediment, turbidity, and Seccchi disk depth), chemical (total nitrogen, total phosphorus, CDOM, DO, BOD, and COD), and microbiological (chlorophyll–a). In addition, remote sensing data are divided into two categories: satellite and non-satellite remote sensing for water quality monitoring. Studies have shown the superiority of remote sensing over in situ conventional methods, which can help in more accurate monitoring of water quality, obtaining optimal policies, and improving the quality of water in the future.
