Unlocking Earth's Secret: The Power of MODIS Sensor on TERRA and AQUA Satellites
How long does it take to observe and process information about Earth's forests or water bodies, covering approximately 40.6 and 361.132 million square kilometers, respectively?
How long does it take to observe and process information about Earth's forests or water bodies, covering approximately 40.6 and 361.132 million square kilometers, respectively? Thanks to the technological revolution, we can now accomplish such tasks in record time. It's not magic—it's innovation. Join us in this article to uncover the answers to these questions and stay informed about the latest advancements in technology. Nowadays, space global observations, which are provided via Earth-observing sensors, have a high position in remote sensing studies, and as Xiond said in 2006, they provide useful and critical information to monitor long-term global climate change and address environmental issues and the product's quality depends on the sensor's calibration precision (Xiond et al., 2006).
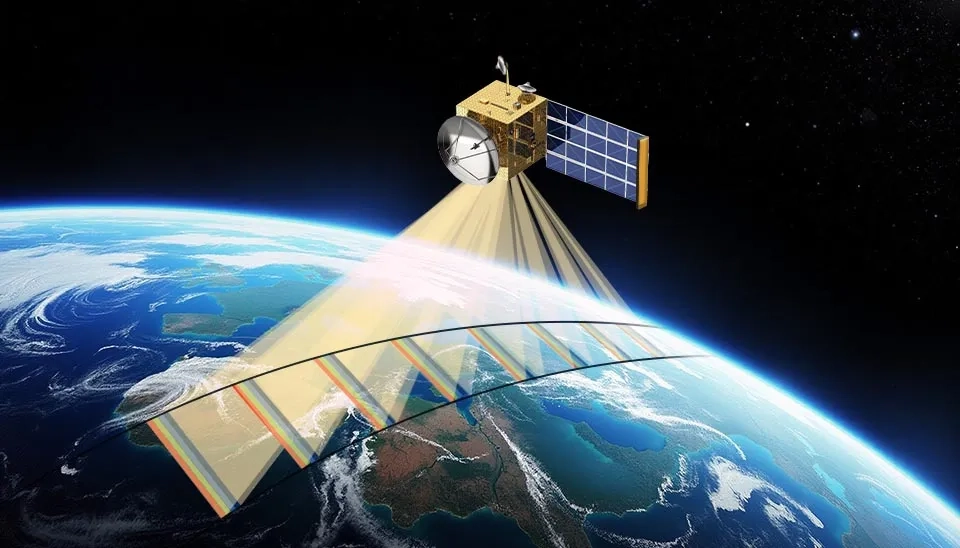
Fig. 1. Stylized graphic of a satellite, symbolizing the MODIS sensors on Terra and Aqua missions.
In the middle of the 1970s, a group of scientists began to recognize the importance of Earth's discovery as a physical system process that is both chemical and biological and spans a large range of time and space. Also, significant advancements in spaceborne remote sensing technology measured the number of important geophysical parameters in a systematic manner (Salomonson et al., 2006). Nineteen scientists and remote sensing technologists from government academia made up the MODIS instrument panel. They examined the earth's remote sensing status and created the MODIS concept, calling for two sensors, MODIS-N (nadir) and MODIS-T (tilt). MODIS-T was a 64-bit imaging spectrometer that could tilt fore and aft to block the sun's glint from the ocean surface, whereas MODIS-N was a traditional imaging filter radiometer with 35 spectral bands (Magner and Salomonson, 1991). Tilt refers to a viewing angle away from the nadir direction, while nadir refers to the direction directly below the sensor, perpendicular to the Earth's surface.
The Moderate Resolution Imaging Spectroradiometer (MODIS) was successfully launched in December 1999 and complemented by another MODIS, which launched in 2002 (Justice et al., 2002). Therefore, there are two MODIS sensors in Earth orbit: one on board the TERRA (EOS AM) satellite, which NASA launched in 1999, and another on board the AQUA (EOS PM) satellite, launched in 2002.
With the launch of these two satellites, a revolution in Earth imaging was sparked. Stay with us to explore the specifications and performance of these satellites together.
Fig. 2. Remote sensing satellite imaging the Earth to collect valuable atmospheric and weather data.
By extending and improving the data records established from several legacy earth-observing sensors, including AVHRR (NOAA advanced very high resolution radiometer), TM (the Landsat thematic mapper), CZCS (the Nimbus 7 coastal zone color scanner), SeaWiFS (the sea-viewing wide field-of-view sensor), and HIRS (the NOAA's high-resolution infrared radiation sounder), MODIS was developed to support NASA's EOS program and meet the needs of the scientific and operational societies (Xiong and Butler, 2020).
Essentially , the MODIS instrument has proven to be an effective tool on its own, and also offers background information to help other sensors produce relevant results; it's frequently referred to as the “keystone” instrument for the result achieved (Xiong et al., 2015).
1. MODIS Satellites (TERRA and AQUA)
The spacecraft for observing Earth carried the MODIS sensor twice a day on board: once in the morning (EOS-AM1) and again in the evening (EOS-PM1), both of which are placed in a 750-km polar sun-synchronous orbit (Masuoka et al., 1998). These two missions eventually got the names EOS “TERRA” and EOS "AQUA,” respectively. The TERRA mission would emphasize land dynamics, while the objective of the AQUA mission would be the hydrological cycle and other related earth processes. These two missions had a five-year duration specified from their inception. Additionally, the MODIS instrument aboard the TERRA and AQUA missions was designed to meet characterization and calibration requirements that would ensure the satisfaction of the scientific community; the data needed to be calibrated to an accuracy of 5% in radiance, 25 in reflectance in the solar spectral band albedo and 1% in the thermal emissive bands; furthermore, the observation was to be exactly geo-located to 150 m with a target of 50 meters (Xiong et al., 2015). In the table below, some basic characteristics of the AQUA and TERRA satellites are given:
Table. 1. MODIS on TERRA and AQUA | MODIS Satellites
satellite/properties
MODIS on TERRA
MODIS on AQUA
Date of launch
December 18, 1999
May 4, 2002
Direction of movement
North to south
(descending)
South to north
(ascending)
Mission Focus
Earth observing at A.M (Ante Meridiem)
land process
Earth observing on P.M. (Post Meridiem)
Hydrological cycle and other related earth atmosphere parameters
The MODIS ProtoFlight Model (PFM) was launched on December 18, 1999 (10:30 AM, descending southward) on the TERRA spacecraft (Xiong et al., 2003); And about 2 years later, on May 4, 2002, a similar instrument was launched on the EOS-AQUA satellite to monitor global atmospheric, oceanic, and terrestrial ecosystems. In this way, MODIS attended to two satellites in orbit, which covered each other by providing observations in the late morning and early afternoon. This covering will provide the long-term datasets with the same geophysical parameters to enhance scientists' studies on climate change and daily variations in rapidly changing systems (Salomonson et al., 2001). Because of the timing of the MODIS’s orbit, TERRA crosses the equator from north to south in the morning, while AQUA crosses it from south to north in the afternoon (NASA, 2025). About 3 decades ago, Xiong et al. analyzed the MODIS instrumental adjectives on the TERRA and AQUA satellites. The result was that AQUA underwent more improvements and adjustments than TERRA to reduce deficiencies and provide better instrument performance (Xiong et al., 2003). TERRA spacecraft also carries other sensors such as MIRS (Multi-angle Imaging SpectroRadiometer), ASTER (the Advanced Spaceborne Thermal Emission and Reflection Radiometer) and CERES (the Clouds and Earth's Radiant Energy System); on the other hand, the AQUA spacecraft is equipped with some sensors too, such as AMSR-E (the Advanced Microwave Scanning Radiometer for EOS), AMSU (the Advanced Microwave Sounding Unit), CERES (the Clouds and Earth's Radiant Energy System), HSB (the Humidity Sounder for Brazil), and finally MOPITT (the Measurement of the Pollution in the Troposphere) (Xiong and Bulter, 2020). One of NASA's primary instruments for the Earth Observing System, TERRA (previously the EOS PM-1) and AQUA (formerly the EOS PM-1), is the MODIS mission (
2. MODIS Characteristics
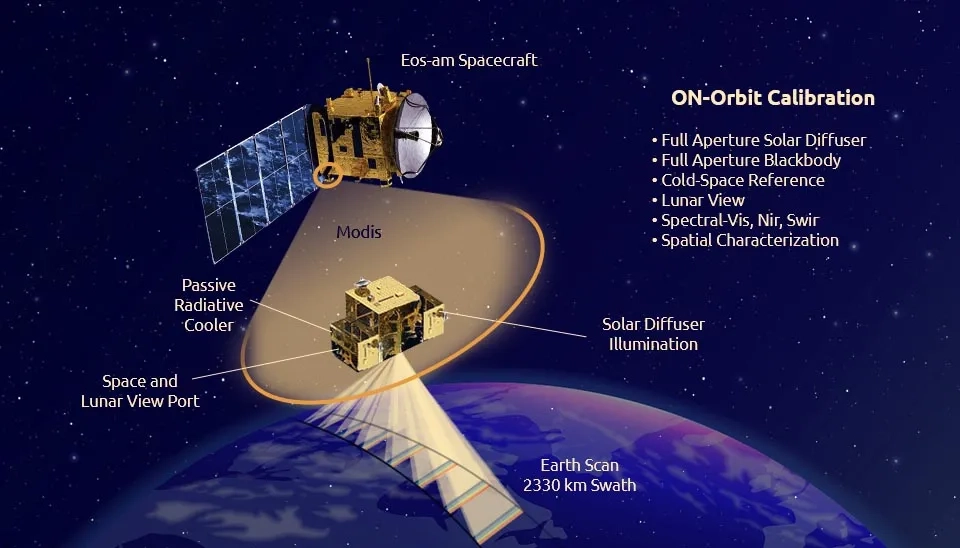
MODIS offers nearly total coverage with its 2330 km viewing width and its ability to cover the whole planet in a single day. More useful information about the physical composition of Earth's atmosphere and surface can be obtained from MODIS high-resolution radiance measurements (Barnes et al., 1998).
This section will focus on sensor details and emphasize the MODIS band.
Fig. 3. The Earth Observing System (EOS) satellite uses a 2330 km wide swath to scan the planet, collecting crucial atmospheric and land data.
2.1. MODIS Sensor Details
The MODIS sensor has excellent temporal (1-2 days) and spatial (250 m-1 km) resolution. The MODIS science team has been able to make 44 products (processed datasets) for different observations thanks to the large number of spectral bands and the ability to draw biological conclusions from this range of data (Engel et al., 2004). Table 2 shows the MODIS features:
Table. 2. MODIS sensor characteristics
First date of launch
1999
Spectral resolution
36 bands
Width cover
2330 km
Temporal resolution
2-4 times a day
Spatial resolution
250m, 500m, 1 km
Scan rate
20.3 rpm, cross track
Swath Dimensions
2,330 km (across track) by 10 km (along track at nadir)
Telescope
17.78 cm diam. off-axis, afocal (collimated), with intermediate field stop
Size
1.0 m* 1.6 m* 1.0 m
Weight
250 kg
Power
225 W (orbit average)
Data Rate
11 Mbps (peak daytime)
Because the data had to be accurate between the many copies of the sensors, the MODIS system also needed to include a level of on-orbit characterization and calibration that was not possible before; the system needs to be able to monitor the sensor's spatial and spectral characteristics while it is in orbit (Salomonson et al., 2006). “Blackboy” is a device that could calibrate MODIS data in thermal bands. NASA designed this device to be non-reflective, hence black, and to operate at a specific temperature (NASA, 2025).
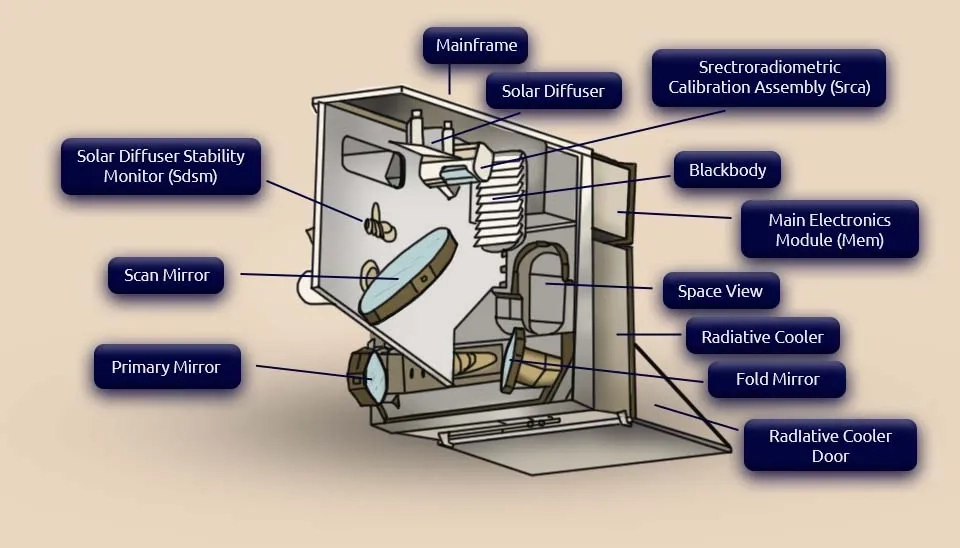
Fig. 4. An exploded view of a satellite instrument, highlighting the mainframe, solar diffuser, and radiative cooler.
2.2. MODIS Bands
MODIS collects data using 36 bands covering spectral regions such as VIS (visible), NIR (near-infrared), SMIR (short- and mid-wave infrared), and LWIR (long infrared) (Xiong et al., 2006). 36 spectral bands, ranging in wavelength from 0.41 to 14.5 µm, are used by each MODIS sensor to produce observations at three different spatial resolutions (nadir): 0.25 km (bands 1-2), 0.5 km (bands 3-7), and 1 km (bands 8-36). For each of these spectral bands there are 40, 20, and 10 detectors, respectively; and according to their wavelength, the detectors for each of the 36 spectral bands are arranged on four focal plane assemblies (FPAs): near infrared (NIR), visible (VIS), short- and mid-wave infrared (SWIR/MWIR), and long-wave infrared (LWIR). While SWIR/MWIR are nominally controlled at 83 K, the VIS and NIR FPAs are uncooled. The reflective solar bands of MODIS are 1-19 and 26, which span in wavelength from 0.41 to 2.2 µm, and the other 16 bands are the thermal emissive bands, which have wavelengths ranging from 3.5 to 14.5 µm (Xiong et al., 2006).
Table 3. MODIS Bands | MODIS Satellites Bands
Bandwidth (nm)
Spatial resolution (m)
Application
620-670
250
Cloud, land, Aerosol Boundaries
841-876
250
Cloud, land, Aerosol Boundaries
459-479
500
Cloud, land and Aerosol properties
459-479
500
Cloud, land and Aerosol properties
545-565
500
Cloud, land and Aerosol properties
1230-1250
500
Cloud, land and Aerosol properties
1628-1652
500
Cloud, land and Aerosol properties
405-420
1000
Ocean color Phytoplankton Biochemistry
438-448
3. MODIS Data
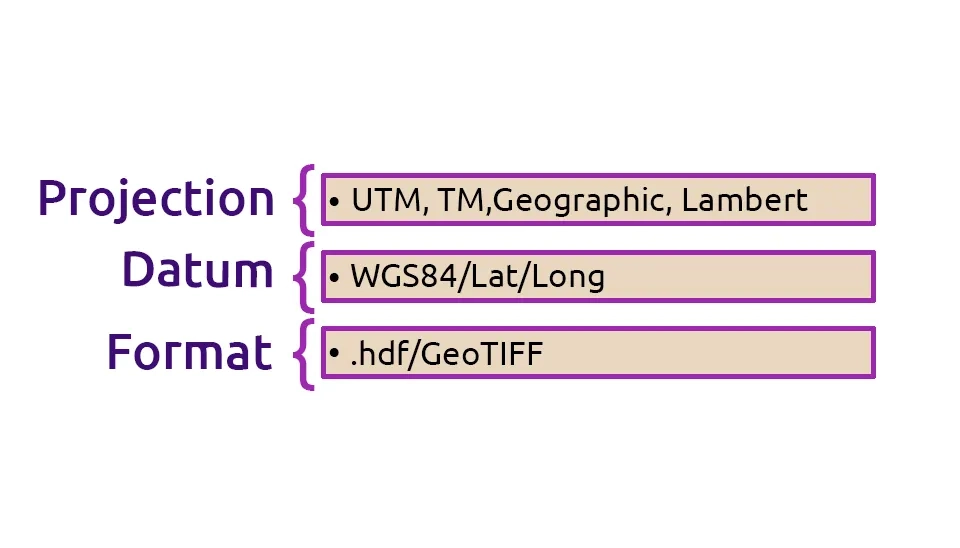
The format used for all MODIS data is HDF-EOS (as shown in Figure 4), an improved version of NCSA's structured data format, which was created to help with the storage of data in worldwide grids over an instrument swath (Masuoka et al., 1998).
Fig. 5. Key components of geographic data, including projection, datum, and file format types.
3.1. Access to MODIS data and Naming them
The Tracking Data Relay Satellite System (TDRSS) sends the MODIS data, along with the data from other instruments on board the AQUA and TERRA spacecraft, to the ground station in White Sands, New Mexico; then they will send it to the EOS Data and Operation System (EDOS) at the Goddard Space Flight Center (NASA, 2025). Figure 5 displays the naming difference between the AQUA and TERRA satellites:
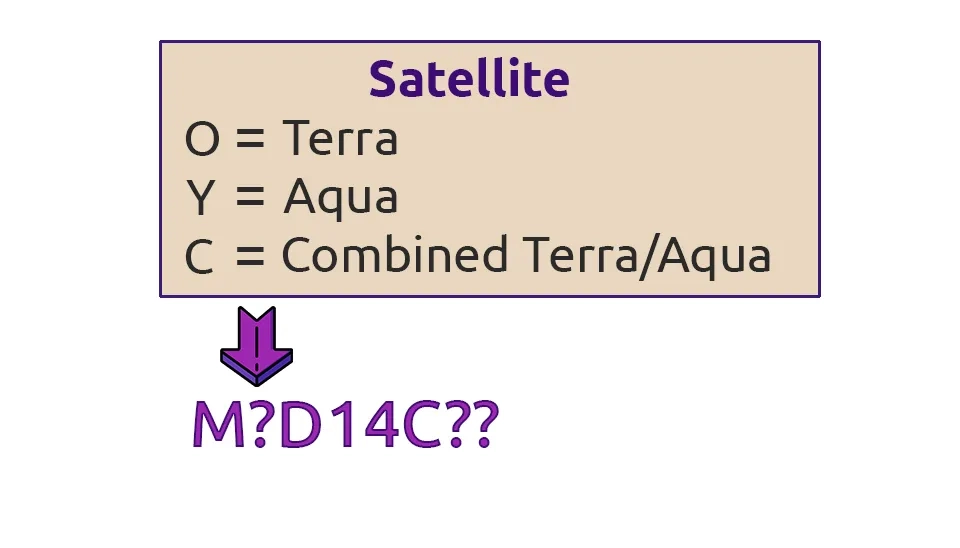
Fig. 6. Decoding satellite data from Terra (O), Aqua (Y), and combined (C) satellite missions.
Here is an example of aerosol product naming:
Terra file: MOD04_L2.AYYYYDDD.HHMM.CCC.YEARDAYHRMNSC.hdf
AQUA file: MYD04_L2.AYYYYDDD.HHMM.CCC.YEARDAYHRMNSC.hdf
The four-digit year, three-digit Julian day, and time of day in UTC are represented by YYYY, DDD, and HHMM. the collection is marked by CCC (005 for collection 5, 051 for collection 5.1 and 006 for collection 6), and the processing date is indicated by YEARDAYHRMNSC (NASA, 2025)
Here is an example of MODIS naming:
MOD14.A2023082.0430.061.2023082091705.hdf
MOD14 - Product Short Name
A2023082 - Julian Date of Acquisition (AYYYYDDD)
0430 - Hours and Minutes of Acquisition (HHMM)
061 - Collection Version
2023082091705 - Julian Date of Production (YYYYDDDHHMMSS)
.hdf - Data Format (HDF-EOS)
Numerous data products obtained from MODIS observations supply information about land, ocean and atmospheric features, which are so useful for the investigation process and improvement at local and global scales. MODIS products are available from a number of sources, including
LAADs website offers the MODIS Level 1 and atmospheric product
Phan and Kappas (2018) analyzed the MODIS surface temperature data as systematic literature and they found that the number of MODIS land surface temperature papers is increasing annually, which presented the high quality and ability of MODIS sensors in land surface temperature data.
The following list includes the most significant MODIS applications:
Land Cover and Land Use Mapping
Vegetation Monitoring
Atmospheric Studies
Ocean Color and Phytoplankton Monitoring
Wildfire Detection
Snow Cover and Ice Monitoring
Natural Disasters Response
Agricultural Monitoring
Water Quality Assessment
Climate Change Studies
Table 4 emphasizes the most important MODIS goals to address:
Table. 4. MODIS targets
MODIS overall objectives
Long-term observation to enhance insight of the global processes on the Earth's surface and lower atmosphere
MODIS atmosphere objective
Investigation of tropospheric dynamic based on cloud characteristics (height, type albedo, etc.), aerosols, water vapor, and surface temperature
MODIS land objective
Temporal and spatial variability of land surface (phenology and vegetation cover, snow and ice radiative properties)
Focus on desertification and regional vegetation stress due to acid rain or drought.
MODIS ocean objective
Temporal and spatial variability of ocean surface properties: sea surface temperature, flow visualization, photosynthetic pigments, attenuation coefficient, and sea ice.
Emphasis on ocean primary productivity
4. MODIS Future Developments
At a time when the world was in need of high-quality global data, VIIRS (Visible Infrared Imaging Radiometer Suite) began to provide it. First, the Moderate-Resolution Imaging Spectroradiometer (MODIS) is getting older, which is a reason for worry since it has been operational much longer than originally intended. Second, following more than 30 years of excellent service, the last and final AVHRR for the afternoon orbit was launched on February 6, 2009. Third, there is no longer any capability to generate data on ocean color using SeaWiFS and MERIS (Medium Resolution Imaging Spectrometer) (Cao et al., 2013).
4.1. VIIRS Sensor Characteristics
The Visible Infrared Imaging Radiometer Suite is one of the important instruments on the Suomi National Polar-Orbiting Partnership (Suomi NPP), which is primarily intended to detect clouds and earth surface features. A new generation of operational environmental remote sensing capabilities for weather, climate, ocean, and other environmental applications was launched on October 28, 2011, with the successful flight of the NASA Suomi NPP satellite carrying VIIRS (Cao et al., 2013). VIIRS is an operational linescan system (OLS) that replaces NOAA AVHRR, NASA EOS MODIS, SeaWiFS, and the Defense Meteorological Satellite Program (DMSP) OLS. It includes 22 spectral bands that span wavelengths from 0.4 to 11.8 μm, and it provides data for the creation of over 20 Environmental Data Records (EDRs) (Cao et al., 2013).
VIIRS, with its sweeping radiometer and a cross-track direction total range viewpoint of 112.56°, provides global moderate-resolution data twice a day without any breaks. The sweep width is 3060 km at a hypothetical equatorial height of 829 km, providing daily coverage of the whole planet during both day and night (Cao et al., 2013). The block diagram, channel characteristics, and VIIRS scan pattern have all been extensively reported in previous studies (Wolf et al., 2012; Cao et al., 2013).
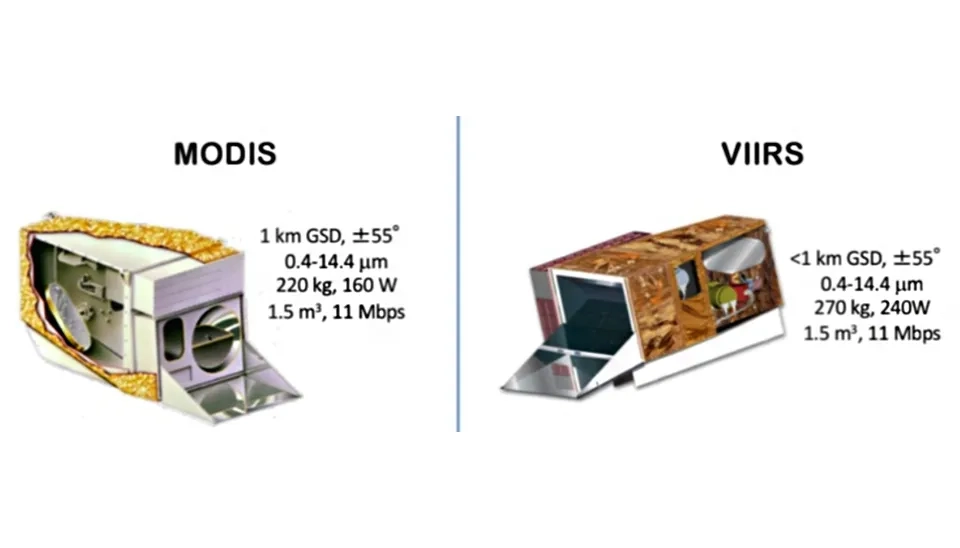
Fig. 7. A side-by-side comparison of the MODIS and VIIRS satellite remote sensing instruments.
Table 5 presents the MODIS and VIIRS sensor feature comparisons:
Table 5. MODIS and VIIRS sensors | MODIS Future
Sensors Properties
MODIS
VIIRS
First Date of Launch
1999
2011
Weight
230 kg
162 kg
Power
147 W
140 W
Volume
2.0 m³
1.2 m³
Spectral Bands
36 bands
22 bands
wavelengths
0.41 to 14.5 μm
0.4 to 11.8 μm
5. Conclusion
Every year, more than 30 science products are produced from MODIS observations, and they are made widely accessible to users all around the world. Moreover, MODIS, with its high temporal, spatial, and spectral resolution, collects data every day from all over the world. This unparalleled capacity allows MODIS to view and collect data on Earth's forests and water bodies in a single day. To sum up, MODIS stands as a pioneering instrument in Earth observation, providing valuable information that strengthens our knowledge of the dynamic processes that regulate our planet. Additionally, MODIS gives researchers a comprehensive view of Earth's land, atmosphere, and ocean. Its capabilities also greatly advance our comprehension of environmental changes occurring throughout the world. On the other hand, VIIRS is a new generation of moderate-resolution imaging capabilities that follows the legacy of AVHRR and MODIS, and after a number of concerns were addressed through post-launch verification and validation, the VIIRS instrument on Suomi NPP has been operating very well, and the data has reached final mature status.
Unlocking Earth's Secret: The Power of MODIS Sensor on TERRA and AQUA Satellites | Waterlyst


Comments
No comments yet
Be the first to comment
Share your thoughts and start the conversation.