Snow Cover Assessment: From On-Site Measurement to Advanced Remote Sensing Analysis
Analyze critical Snow Parameters (SWE, depth) using modern On-site methods and powerful Sentinel-1 SAR and AMSR-2 satellite data. Essential for global hydrology and flood modeling.
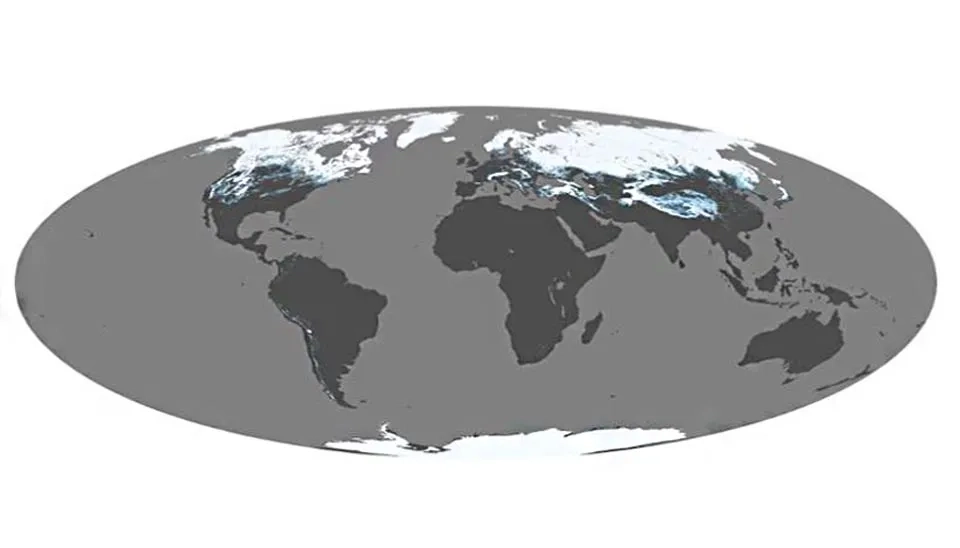
The presence of seasonal snow cover plays a vital role in the hydrological cycle and significantly contributes to the regulation of Earth’s environmental energy budget (Varade et al., 2020). Snow cover has the potential to decrease global temperature by reflecting 80 to 90 percent of solar energy [3] (Zhang., 2005). Moreover, one can utilize it for hydroelectric power generation (Storvold et al., 2012). Therefore, it is essential to know the snow cover assessment. On the other hand, snowfall commonly occurs in mountainous areas, thus limiting the gathering of snow cover assessment in desert sites due to local weather conditions, infrastructure, human resources, and budget and equipment constraints (Varade et al., 2020). Hence, one can utilize remote sensing tools. Remote sensing can provide snow cover assessments without access to mountainous areas and advanced tools[4] . Also, estimating snow parameters using satellite data effectively reduces costs and increases accuracy (Varade et al., 2020). Figure 1 shows the global distribution of snow cover. As it is known, most of the Earth’s northern and southern regions of the globe contain snow cover.
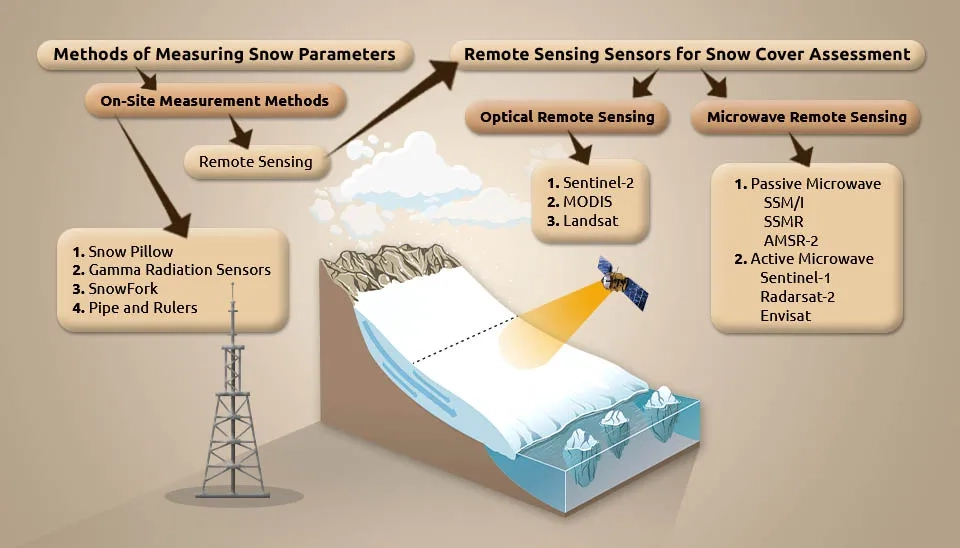
Fig. 1. Snow Cover Assessment Methods: Detailed schematic of On-Site (Snow Pillow) and Satellite Sensors.
Table 1. A summary of the advantages and disadvantages of on-site measurement methods and satellite-based snow cover assessment
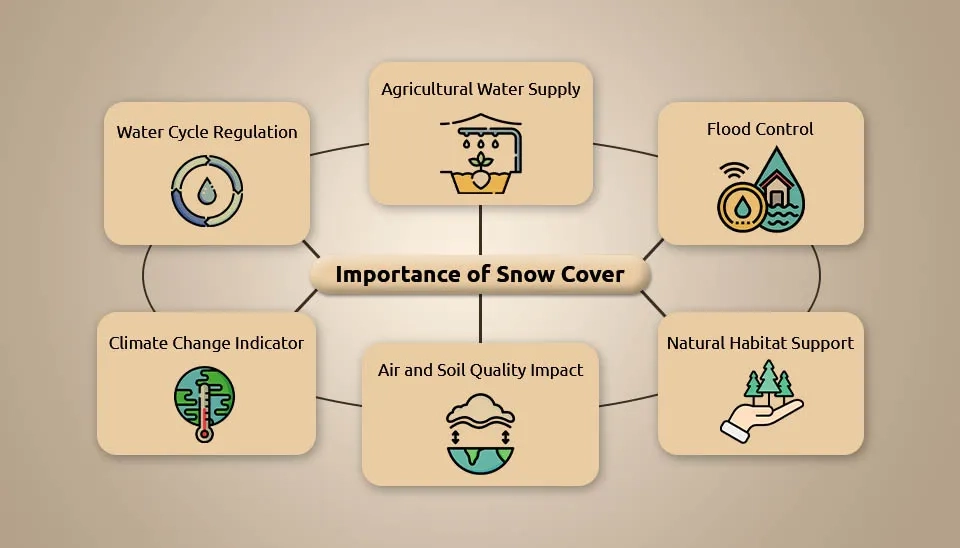
Snowfall covers approximately 46 million square kilometers of the Earth’s surface annually (Awasthi and Varade, 2021). Snow cover is one of the most important influencing parameters in the hydrological cycle and can provide about one-sixth of fresh water to the world’s people (Mithen and Black 2011). Moreover, snow cover contributes to the sustainability of biodiversity by preserving ground moisture conditions (Akshay Patil et al., 2020). Snowmelt supplies significant rivers on the Earth, which can be used for runoff prediction. Forecasting floods and planning production at hydropower plants utilize these predictions. In Norway, 98% of electricity production comes from hydropower. 50% of hydropower comes from melted snow (R. Storvold et al., 2012). The Snow Water Equivalent (SWE) parameter defines the amount of liquid water in the snowpack. SWE is a primary input parameter driving the hydrological models. According to Li et al, 2017, snow density and snow depth are the factors that determine SWE. Figure 2 shows the importance of snow cover assessment.
Fig. 2. The importance of Snow Cover Assessment in water management, flood control, and climate regulation.
2. Methods of Measuring Snow Parameters
Snow measurement instruments or sensors are used to measure snow density, snow depth, Snow Water Equivalent (SWE), snow wetness, snowpack temperature, and thermal properties. We measure the snow depth by directly measuring the distance from the ground to the snowpack’s surface, using a calibration in centimeters or meters. Additionally, we measure snow density as the mass of snow per unit volume (gm/cm^3). To calculate the SWE, we multiply the average snow density by the total snow depth of the snowpit. The methods of measuring snowpack parameters include on-site measurement of snow cover and satellite-based snow cover assessment. We will introduce them below.
2.1. On-site Measurement Methods
The on-site measurement of snow cover is typically conducted through point and line measurements at snow courses. Point measurement of the snowpack can be performed using various methods, such as snow pillows (Lundbreg et al., 2010), active and passive gamma radiation sensors (Bland et al., 1997), snow forks, and pipe and ruler techniques. We conduct line measurements along the snow course using Ground Penetrating Radar (GPR), operated from airborne or ground-based platforms (Lundberg et al., 2010). Unlike point measurements that capture only the temporal behavior of snow parameters, linear measurement provides variable insights into their spatial distribution.
2.1.1. Snow Pillow
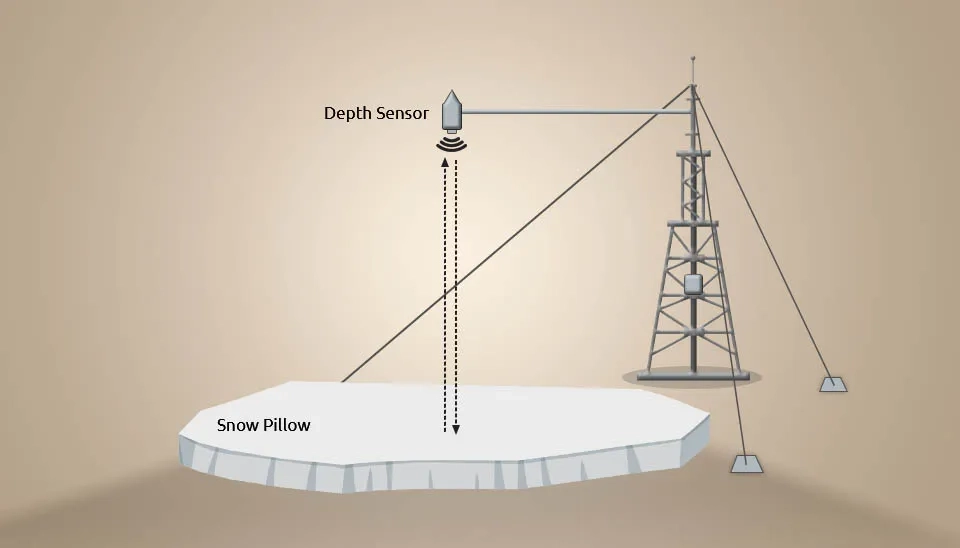
The snow pillow is a valuable tool for measuring snow cover parameters, particularly in automatic reporting stations such as SNOTEL (Snow Telemetry).[6] This instrument measures the snowwater equivalent based on the hydrostatic pressure created by the accumulated snow (Lundbreg et al., 2010). By increasing the size of the pillow, any effects caused by bridges are minimized. Snow pillows also find application in estimating the snow load on a roof, serving as a warning for potential roof collapse. Yukimakura was developed initially in the early 1960s. Figure 3 shows an example of a snow pillow.
Fig. 3. Snow Pillow: On-site Measurement Method using hydrostatic pressure to measure SWE.
2.1.2. Gamma Radiation Sensors
Gamma-ray sensors measure the emission of gamma rays naturally emitted from the Earth. An attenuation of the gamma-ray emission occurs with snow accumulation. Consequently, the snow-water equivalent is determined by analyzing the attenuation of gamma-ray emission (Grasty, 1982). Snow with a higher water content level provides a high attenuation of gamma-ray radiation. This sensor offers several advantages: (1) It isn’t affected by weather conditions; (2) It covers a wide range of surfaces; and (3) it is easy to install and effective for measuring types of snow and ice. (Grasty., 1982). Figure 4 shows an example of a gamma radiation sensor.
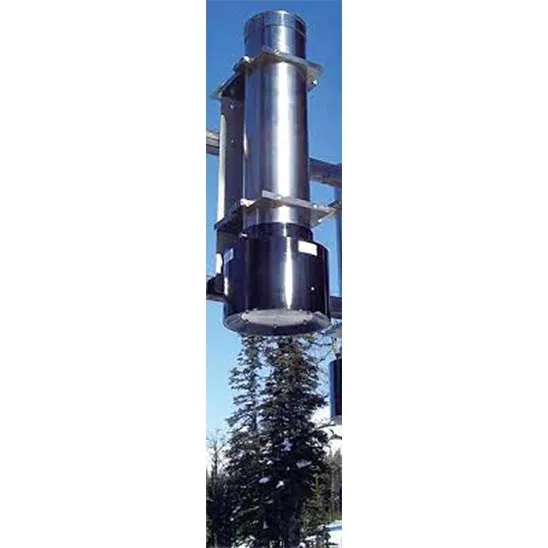
Fig. 4. Gamma Radiation Sensor used for On-site Measurement Methods of snow water equivalent (SWE).
2.1.3. SnowFork
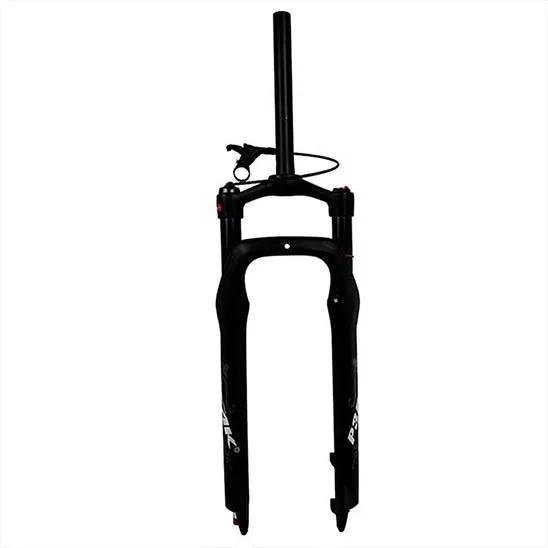
The snow fork manufactured by TOIKKA measures the real and imaginary components of the dielectric constant of snow using microwave resonance in the range of 500 to 900 MHz the dielectric constant can be related to snow density and Liquid Water Content (LWC) through semi-empirical relationships (Tiuri and Sihvola, 1986). Snowfork work facilitates the prompt and enables on-site measurements of snow cover, which are often impossible with other instruments like snow tubes, especially when faced with limited manpower[10] (Varade et al., 2020). The snowfork probe is placed 5 cm in each layer and measures snow parameters. Finally, it is averaged for each layer and the entire snowpack.
Fig. 5. Snow Fork: On-site Measurement Method for measuring the dielectric coefficient of snow.
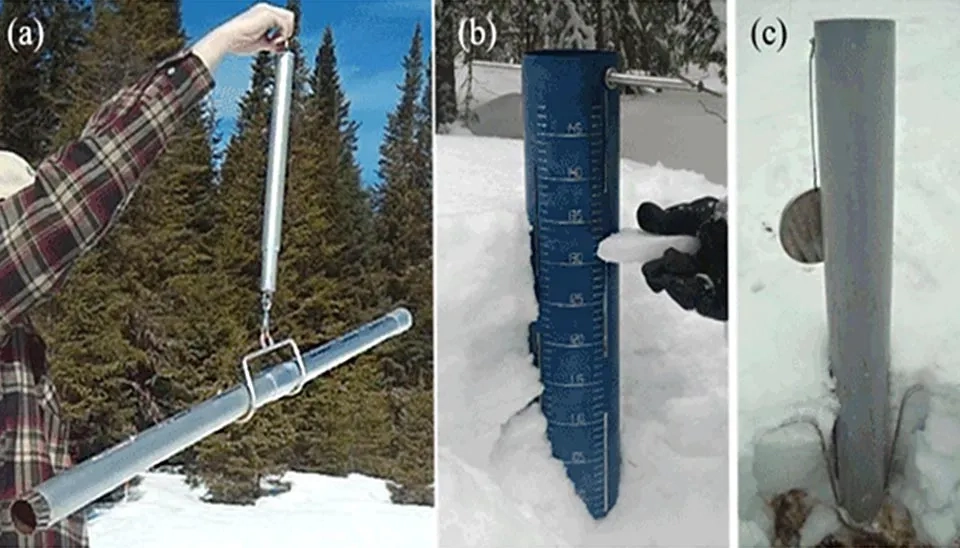
2.1.4. Pipe and Ruler
A pipe and ruler are two simple tools for on-site measurement methods in snow cover assessment, including the snow density and snow depth parameters. The snow density is calculated by measuring the weight and volume of the empty and full snow pipe. Snow depth is measured by placing a ruler in the snowpack (Mahmoodzada et al., 2020).
Fig. 6. Pipe and Ruler: Inexpensive On-site Measurement Methods for snow density and depth
2.2. Remote Sensing
Remote sensing is a tool that can study various Earth phenomena such as wind, soil, atmosphere, snow, and ocean using satellite data of the Earth. It enables the estimation of several snow parameters, such as snow temperature, snow wetness, the dielectric constant of snow, snow cover area, snow density, and snow depth.
3. Remote Sensing Sensors for Snow Cover Assessment
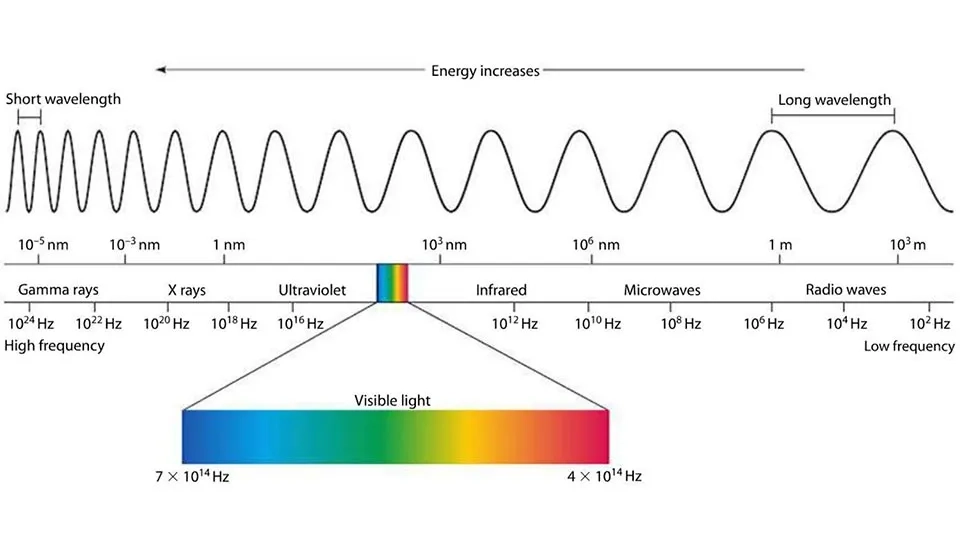
Remote sensing tools are classified into optical and microwave remote sensing. Optical remote sensing includes part of the electromagnetic spectrum, which is the wavelength of the signal sent in the visible range (0.4 micrometers), near-infrared, and thermal infrared (15 micrometers). The range activity of microwave remote sensing is 1 cm to 1 m. In the following, we introduce optical and microwave remote sensing and their applications (Carver et al., 1985).
Fig. 7. The Electromagnetic Spectrum used by Remote Sensing for Snow Cover Assessment
3.1. Optical Remote Sensing
In optical remote sensing, the transmitted signal has a low wavelength, which limits its ability to penetrate the snowpack. Therefore, the received signal only captures information about the snow surface (D. Varade and O. Dikshit 2018), such as snow surface temperature, snow cover area, snow surface particle size, and snow surface depth. However, this tool offers large-scale images, making it highly valuable for snow parameter assessment with satellite imagery. Below is a list of some satellites that operate within this range.
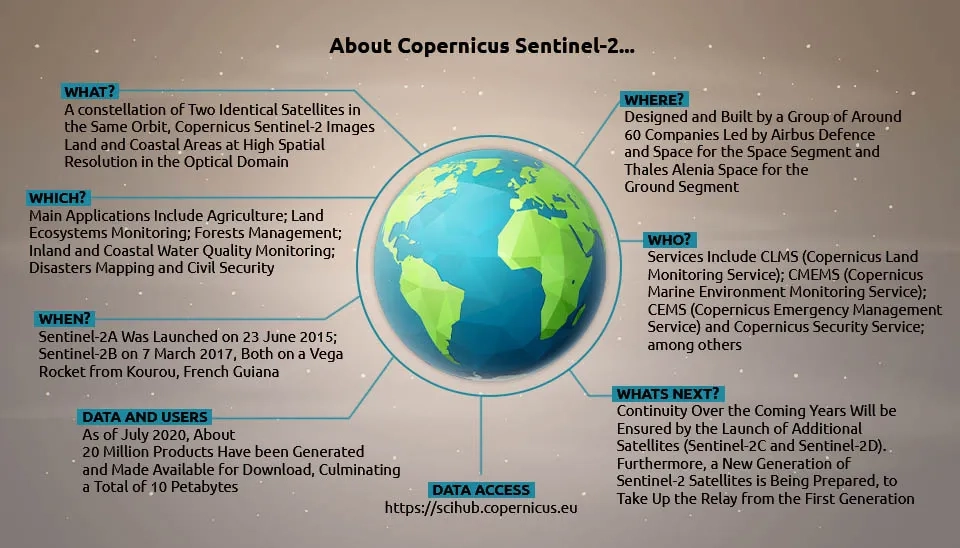
3.1.1. Sentinel-2
The Sentinel-2 mission comprises two satellites in polar orbits, positioned simultaneously with the solar orbit and 180 degrees apart from each other. Its primary objective is to monitor changes in land surface conditions. With wide bands spanning 290 km, it offers a revisiting time of 10 days at the equator with one satellite and 5 days with two satellites under cloudless conditions, resulting in 2–3 days at the middle latitudes. The Sentinel-2 satellites are equipped with a multi-spectral instrument featuring 13 spectral bands, ranging from the visible range to the shortwave infrared. One of the valuable applications of Sentinel-2 is the generation of snow cover maps (Rittger et al., 2020). In addition, Gascoin et al., 2018 used Sentinel-2 data to detect snow cover in Western Europe. The process begins by distinguishing snow from clouds based on the value of the visible spectrum. Subsequently, the Normalized Difference Snow Index (NDSI) is utilized to assess the degree of freezing or freshness of the snow. Another use of Sentinel-2 in determining snow parameters is the surface LWC of snow (Varade and Dikshit, 2018). Also, (Varade and Dikshit, 2019) delineated an empirical relation for modeling snow LWC using the spectral reflectance in visible and infrared bands of sentinel-2 multispectral data and subsequently derived an approximation of snow density using the LWC.
Fig. 8. Sentinel-2: Key facts for Satellite-Based Snow Cover Assessment data users and access.
3.1.2. MODIS
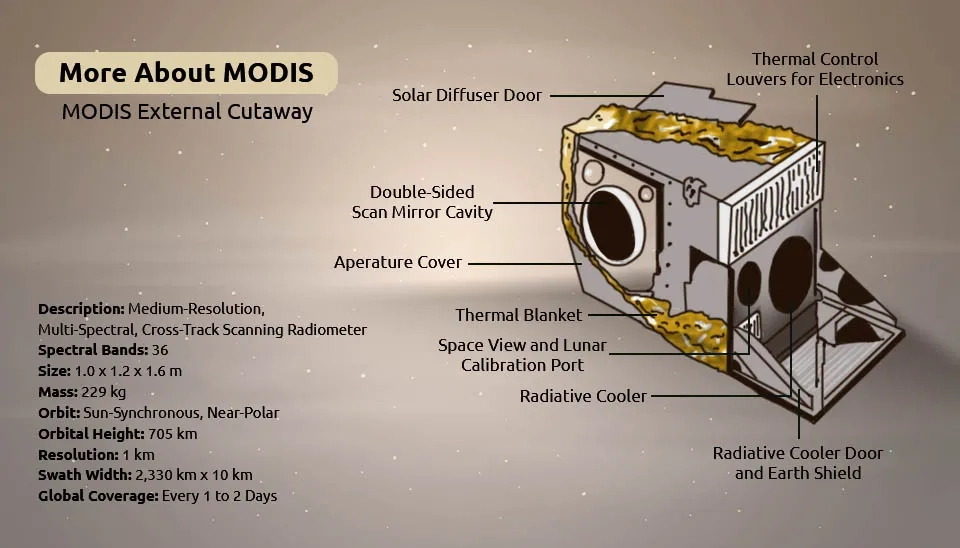
The MODIS (Moderate Resolution Imaging Spectroradiometer) is a significant instrument on the Terra and Aqua satellites. The Terra satellite crosses the equator from north to south in the morning, while Aqua crosses the equator from south to north in the afternoon. Terra MODIS and Aqua MODIS take images of the entire earth’s surface every 1-2 days and record data in 36 spectral bands. These data are utilized to enhance our understanding of processes taking place on land, in oceans, and in the lower atmosphere. One of the applications of MODIS is to determine the parameters of the snowpack, which can be referred to as the preparation of snow cover maps (Lee et al., 2017) with a spatial resolution of 500 meters. The advantage of the MODIS satellite is the snow and ice cover products that have been available through the National Snow and Ice Data Center (NSIDC) Distributed Active Archive Center (DAAC) since September 13, 2000 (Dorrothy et al., 2002).
Fig. 9. MODIS information on size, bands, orbit, and resolution for Snow Cover Assessment.
3.1.3. Landsat
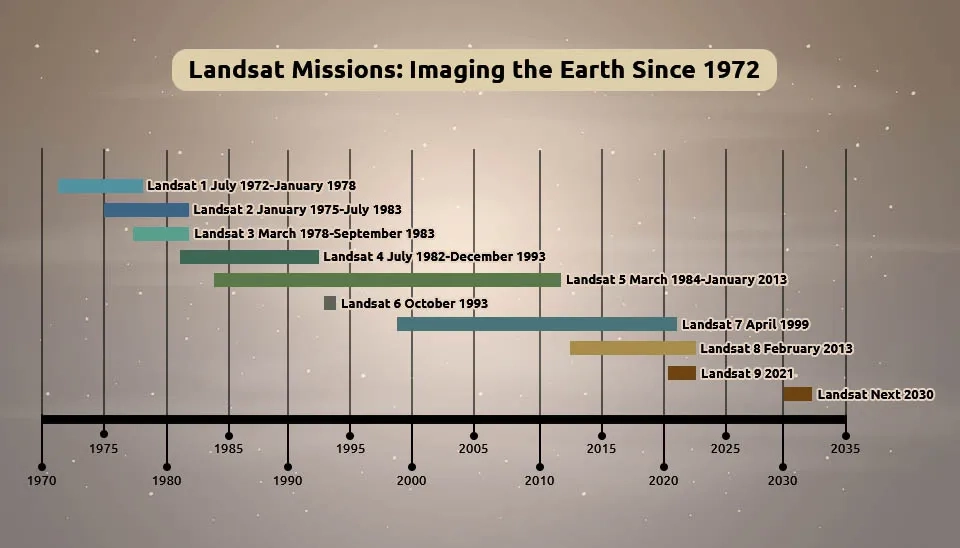
The Landsat program is one of the longest projects to take pictures of the earth’s surface, implemented in 1972. The initial program, known as Lansat 1, was launched, and more recently, Landsat 9 has also been deployed (Hemati et al., 2021). Similar to Sentinel-2 and Modis, the Landsat satellite is also used for snow cover zoning (Rosenthal and Dozier, 1996). Moreover, its thematic bands offer valuable insight into qualitative assessments of snow contamination and snow grain size (Jeff Dozier 1989).
Fig. 10. History of image acquisition by Landsat satellite from Landsat-1 to Landsat-9.
3.2. Microwave Remote Sensing
Another method of satellite imagery-based snow analysis is microwave remote sensing. In microwave remote sensing, due to proper penetration of the signal inside the snowpack, it is possible to estimate parameters of snow microstructure such as snow density, snow depth, snow wetness, and snow particle size (Awasthi and Varade, 2021). Microwave remote sensing includes active microwave and passive microwave, which are described below.
3.2.1. Passive Microwave
Passive microwave remote sensing comes into play when the natural energy source is mainly the sun. Passive microwave remote sensing can be used to map snow cover and get information about the snow (Kung et al., 2019) Because the received brightness temperature of the ground surface when there is no snow will be higher than when snow is on the ground (Akshay Patil et al., 2020. Some passive microwave sensors used in determining snow parameters are introduced below.
3.2.1.1. SSM/I
The SSM/I (Spatial Sensor Microwave/Image) sensor is one of the sensors of the 5D-2 satellites, which has 7 channels, 4 frequencies, and is orthogonally polarized. By measuring the brightness temperature of natural phenomena such as the atmosphere, ocean, terrain, and snow with this sensor and using existing algorithms, it is possible to estimate the parameters of the depth and extent of snow cover (Tedesco et al., 2004; Grody and Basist, 1996). In another study, snow was detected using the brightness temperature in the bands 37 GHz and 19 GHz. Band 37 shows a lower brightness temperature during a snowpack, while Band 19 depends only on temperature; the difference between these two bands indicates a snowpack. Then, according to the thermal gradient created by the snow, there was a relationship between the ground temperature, air temperature, and snow depth (Grippa et al., 2005).
Fig. 11. Snow depth product of SSM/I satellite data on 15/10/2023.
3.2.1.2. SSMR
The SSMR (Multi-Channel Sensor Microwave Radiometer) was a ten-channel sensor that measured orthogonally polarized antenna data at five microwave frequencies: 6.6, 10.7, 18.0, 21.0, and 37.0 GHz. This sensor can prepare spatial and temporal distribution maps of snow water equivalents (Chien et al., 1998)
3.2.1.3. AMSR-2
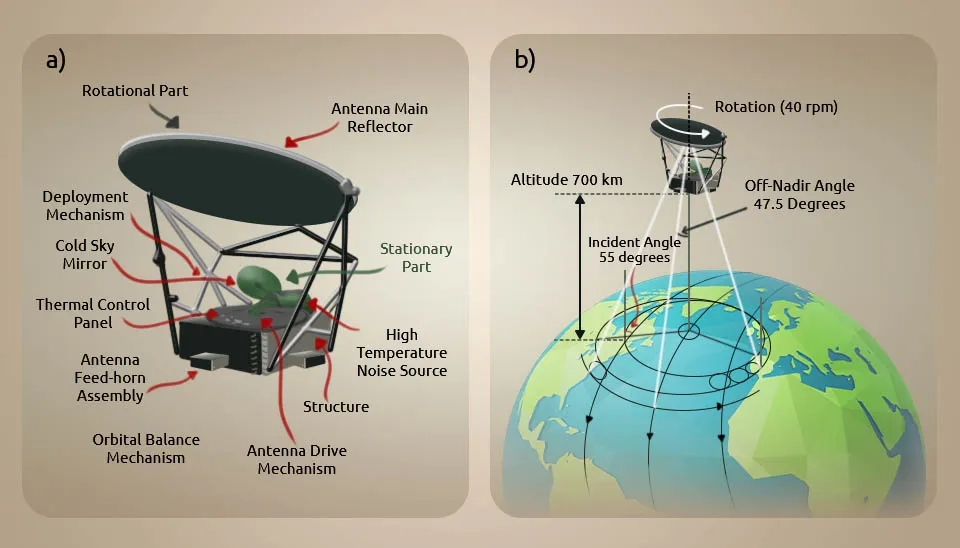
The Advanced Microwave Scanning Radiometer 2(AMSR-2) is onboard the GCOM-W1 satellite, a remote sensing instrument for measuring weak microwave emissions from the Earth’s surface and atmosphere. The height of this satellite is about 700 km from the Earth and it measures the intensity of microwave emission and dispersion. The AMSR-2 antenna rotates once every 1.5 seconds and acquires data over 1450 km. This sensor evaluates the snow depth (Zhang et al., 2016). In this research, snow depth products were improved. This algorithm estimates the depth of snow using brightness temperature ranges in two bands of 36 and 18 GHz.
Fig. 12. AMSR-2 information for the Estimation of Snow Parameters using satellite data.
3.2.2. Active Microwave
Active microwave sensors generate waves that are directed toward the target, allowing for the detection of target geometry or characteristics based on the received energy. These sensors offer high spatial and temporal resolution, and their data is always available as they do not rely on an external energy source to transmit signals (National Research Council of Italy). Here are descriptions of some active microwave sensors.
3.2.2.1. Sentinel-1
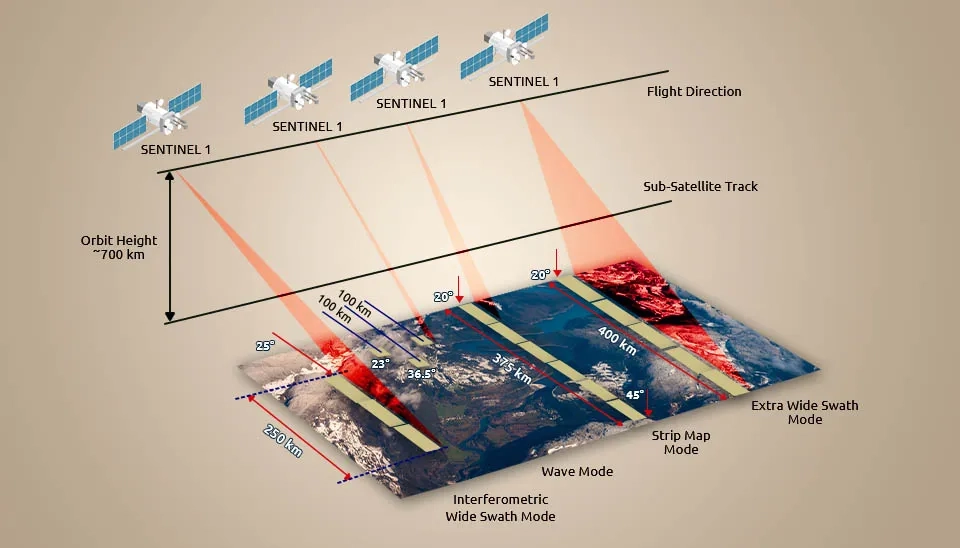
One of the active microwave remote sensing satellites is Sentinel-1, which can be used for snow parameter analysis using satellite data. The sentinel-1 mission includes two satellites, sentinel-1A and sentinel-1B. Which are moving in a 693 km orbit. This mission provides continuous radar observation with an improved number of repeats, wider coverage, and high reliability for applications that require time series images. The frequency of the waves on this satellite is 5.405 GHz and it takes images in VV (Vertical send and Vertical receive) and VH (Vertical send and Horizontal receive) polarization. The data from this satellite is available in Interferometric Wide Swath (IW), Extra Wide Swath (EW), Wave (WV), and Strip-Sap (SM) modes and SLC and GRD formats. Sentinel-1 data can be utilized to determine the snow depth (Varade et al., 2020). Furthermore, an algorithm has been developed that utilizes the radar equation to estimate the snow density, which is then employed in the snow depth estimation[21] (Mahmoodzada et al., 2020). In this study, the proposed algorithm for snow density is the radar equation in VV, and for snow depth, it is Snell’s law and scattering in the snowpack.
Fig. 13. Details of Sentinel-1 satellite imaging for Snow Cover Assessment.
3.2.2.2. Radarsat-2
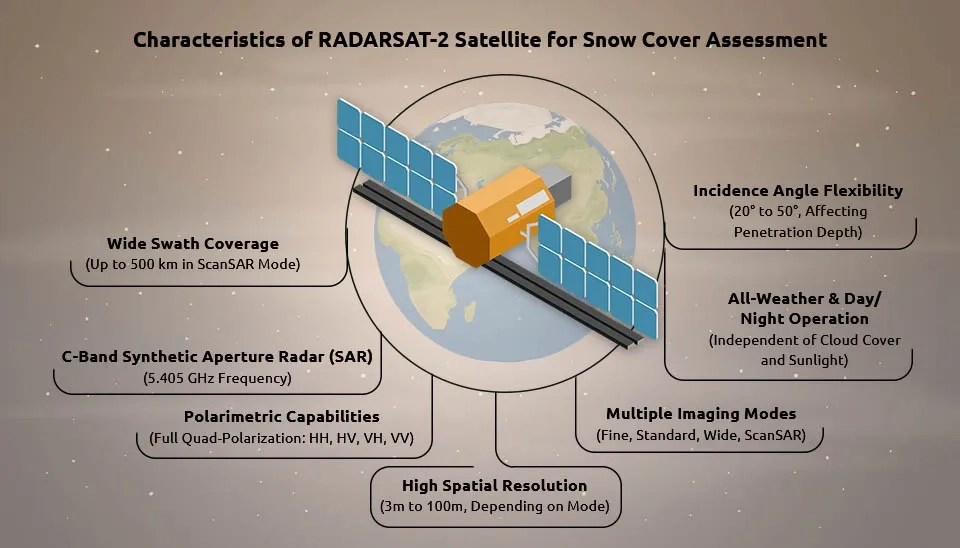
Another satellite used in estimating snow parameters using satellite data is the RADARSAT-2 sensor. RADARSAT-2 continues to obtain the same data as RADARSAT-1 with better spatial resolution, high flexibility in choosing polarization and right and left views. The data on this satellite is fully polarized. This satellite is located at an altitude of 792 km to 821 km (Morena et al., 2004). The data from this satellite is more useful in estimating snow parameters due to its full polarization. This satellite has been used to study the roughness and dielectric coefficient of snow, which can determine the snow density and snow wetness according to the experimental relationships[23] (Varade. et al., 2020; Li et al., 2022). The models provided by this satellite are obtained from the radar equation model and the snow backscattering model.
Fig. 14. Characteristics of RADARSAT-2 satellite for Snow Cover Assessment.
3.2.2.3. Envisat
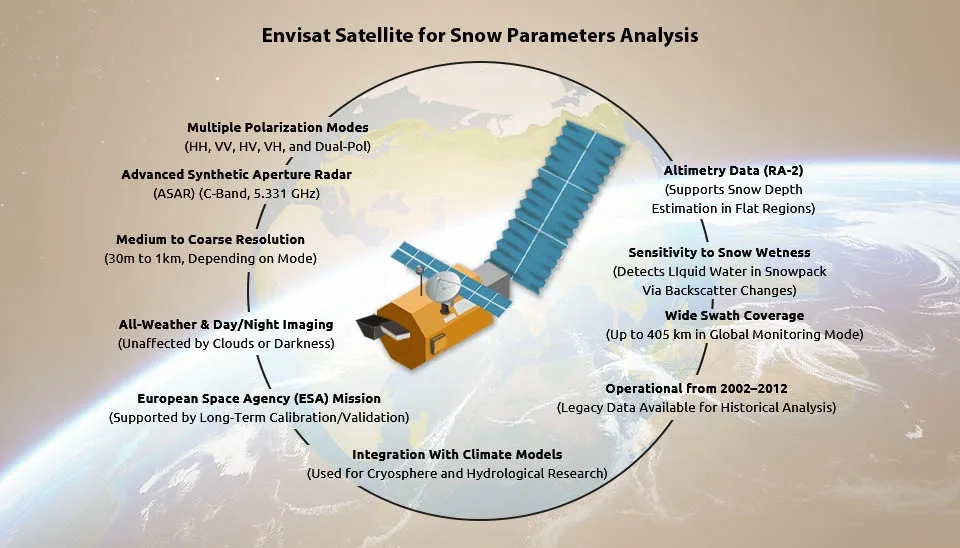
In 2002, the European Space Agency launched an advanced satellite named ENVISAT. Envisat has 10 sensors, one of which is ASAR, and it is used to acquire Synthetic Aperture Radar (SAR) data. Asar captures the image in dual and combined polarizations (Henry et al., 2005). This satellite has been used for snow cover assessment, such as the estimation of snow density (Snehmani et al., 2010). The model is obtained by combining the surface and volume backscattering of the snowpack.
Fig. 15. ENVISAT Satellite for Snow Parameters Analysis using satellite data.
4. Conclusion
As discussed, active and passive microwave and optical remote sensing are used for snow parameter assessment with satellite data. However, each will have advantages and disadvantages. Optical remote sensing is not able to estimate the volumetric parameters of snow due to the lack of signal penetration in snow. On the other hand, its data is only available in cloudless weather. However, it has easy algorithms to determine snow parameters. Although passive microwave remote sensing provides volumetric information on snowpack parameters, it can’t estimate snowpack parameters on a small scale or with high accuracy due to its low spatial resolution. Active microwave remote sensing has a high spatial and temporal resolution, but often complex algorithms must be calculated to determine snow parameters.
Snow Cover Assessment: From On-Site Measurement to Advanced Remote Sensing Analysis | Waterlyst


Comments
No comments yet
Be the first to comment
Share your thoughts and start the conversation.