The Tropical Rainfall Measuring Mission (TRMM) Instruments
Precise precipitation measurement is crucial for hydrology and scientific research in meteorology, environment, climatology, agriculture, and water resource management.
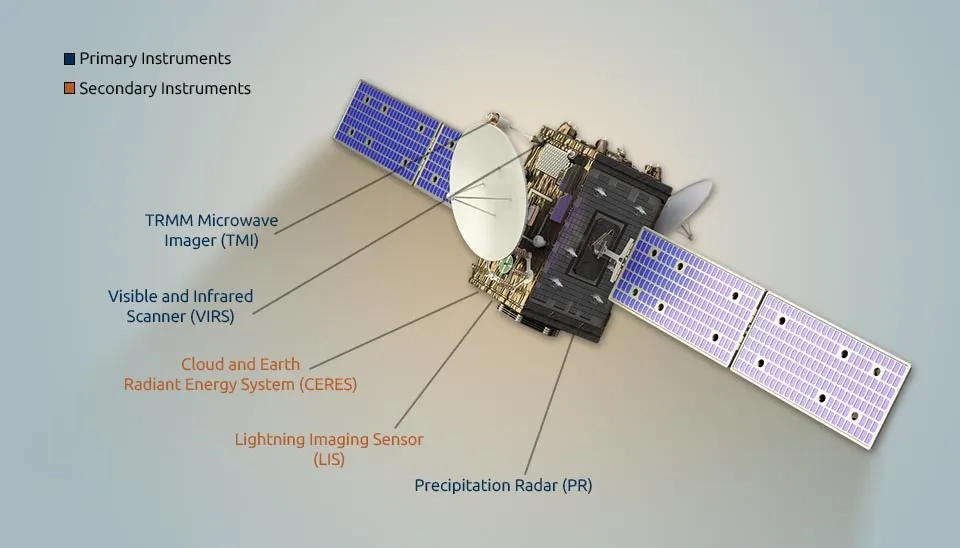
Precise precipitation measurement is crucial for hydrology and scientific research in meteorology, environment, climatology, agriculture, and water resource management (Qing Cao et al. 2013). Tropical precipitation is an important component of the atmospheric general circulation, making the study of cloud and precipitation systems essential for understanding the climate system. Such analysis is possible by using satellite data to allow for global-scale coverage and long-term monitoring of activity (Kondo et al., 2006). The Tropical Rainfall Measuring Mission (TRMM) is a joint mission between the National Aeronautics and Space Administration (NASA) of the United States and the National Space Development Agency (NASDA) of Japan with the main goals of assessing rainfall and energy exchange in tropical and subtropical areas (Kumerow et al., 1998). The satellite includes three precipitation measuring instruments: the Visible and Infrared Scanner (VIRS), the Precipitation Radar (PR), the TRMM Microwave Imager (TMI), and two Earth Observing System (EOS) instruments, including the Clouds and Earth's Radiant Energy System (CERES) and the Lightning Imaging Sensor (LIS) (Tomomi Nio et al., 2015).
However, instruments on satellites seldom directly measure the required physical quantity, such as the surface rain rate in the case of TRMM, necessitating the use of retrieval algorithms. In this regard, numerous assumptions lead to discrepancies between estimates and reality. Validation of estimates and the development of retrieval algorithms are being continually conducted (Nakamura, 2021). This article will explain the types of Tropical Rainfall Measuring Mission (TRMM) sensors, including PR, TMI, VIRS, LIS, and the CERES instrument, along with their characteristics.
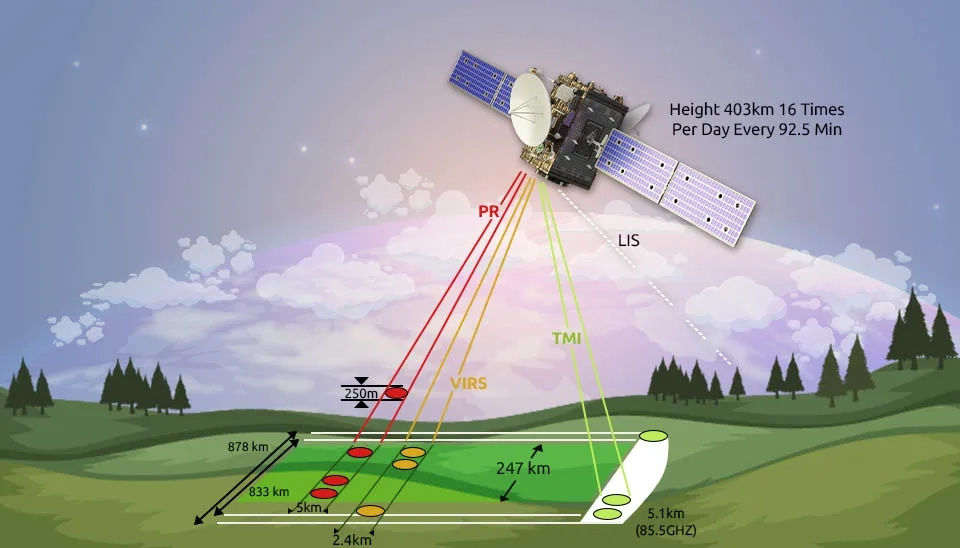
Fig. 2. A schematic diagram showing the observation concepts of the TRMM satellite's PR, VIRS, and TMI instruments.
1.1. Precipitation Radar (PR)
The Tropical Rainfall Measuring Mission (TRMM) satellite carried the first spaceborne radar titled The Precipitation Radar (PR), which was designed to measure tropospheric precipitation vertically (Kawanishi et al., 2000). PR, because of its satellite platform, has an unobstructed view of the entire tropical region from space, allowing it to overcome limitations faced by ground-based radars. Therefore, it was essential to achieving TRMM's goals of measuring precipitation and latent heating (Simpson et al., 1988).
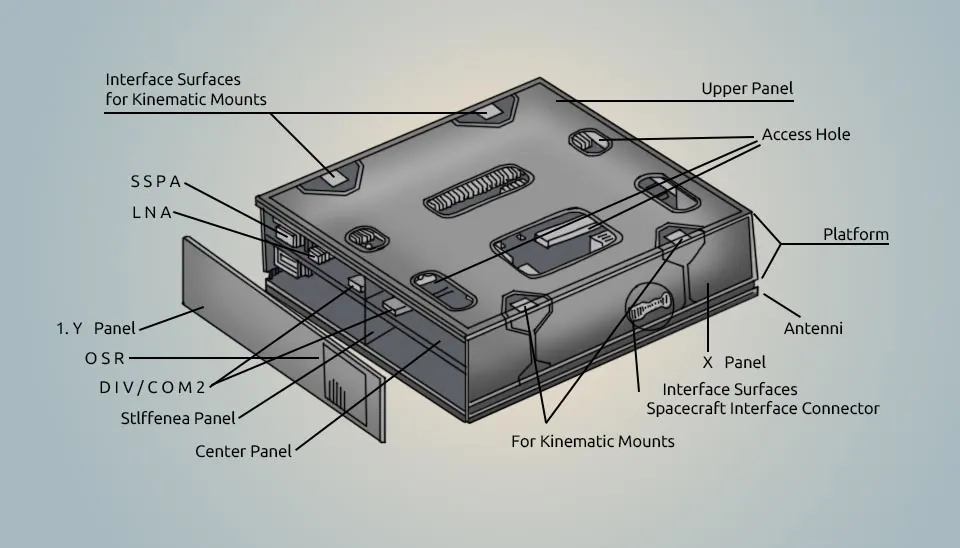
Fig. 3. A diagram of the Precipitation Radar, showing its kinematic mounts, access holes, panels, and other internal components.
1.1.1. Mission Overview of TRMM sensor (PR)
Among the primary instruments on TRMM, the most innovative is the precipitation radar. NASDA and the Communication Research Laboratory (CRL) were responsible for developing it. The pulse radar, which had an electrical scanning capability and utilized a slotted waveguide system, observed precipitation from a satellite traveling at a speed of 7 km/s (Nakamura et al., 1990; Kozu et al., 2001). The PR was the heaviest instrument onboard the TRMM satellite, with a weight of 465 kg (Nakamura, 2021). With an operating frequency of 13.8 GHz (ku band), the PR is a 128-element active phased array that enables fast and advanced cross-track scanning across a 215 km swath width, achieving a cross-range spatial resolution of about 4.3 km. The PR can detect rain as low as 0.5 mm/h with a range resolution of 250 m (Kozu et al., 2001). 1.1.2. Objectives of PR
The goal is to improve the total accuracy of TRMM precipitation retrieval using a combination of active (PR) and passive (TMI and VIRS) sensor data.
The goal is to obtain quantitative precipitation measurements over land and ocean.
The goal of this study is to provide a 3D structure of rainfall, particularly of the vertical distribution.
1.1.3. Characteristics of Sensor
The characteristics of the sensors, as detailed in the following references (Kozu et al., 2001; Kummerow et al., 1998; Nan Li et al., 2019; TRMM Data Users Handbook, 2001; WMO OSCAR), are important for understanding their performance.
Satellites this instrument is flying on: TRMM
Purpose: Vertical profile of precipitation
Radar Type: Active phased-array radar
Scanning Technique: Electronic scanning, planar array of 128 elements
Frequency: 13.796 GHz and 13.802 GHz (Two-channel frequency agility)
Wavelength: about 2.2 cm
Sensitivity: ≤ ≈ 0.7 mm/h (S/N/pulse ≈ 0 dB)
observation range: Surface to 15 km altitude
Observation mode: Cross-track scan
Swath width: 247 km with a horizontal resolution at the ground (5 km after the boost and 215 km with 4.3 km at the launch).
Vertical resolution: 0.25 km (at nadir)
Horizontal resolution:4.3 ± 0.12 km (at nadir)
Number of indep. samples: 64
Data rate: 93.2 kbps
Mass: 465kg
Power: 250W
Utilization Period: 1998–2015
Coverage/Cycle: Intertropical coverage 1 to 2 times/day depending on latitude (best coverage at 15°N and 15°S)
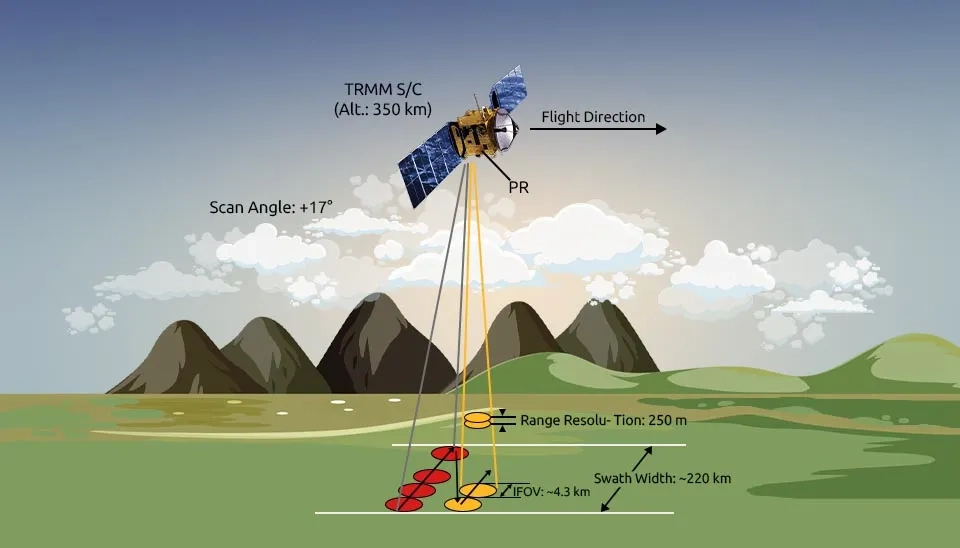
Fig. 4. An observation diagram of the TRMM satellite, showing the PR's scanning angle, range resolution, and swath width
1.1.4. PR Instrument’s Performance
Due to its shorter wavelength, the PR can detect liquid and frozen particles in the returned echo, unlike the TMI 85.5-GHz channels (Matsui et al., 2016). The TRMM boost in August 2001, from 350 km to 402.5 km, had significant effects on PR observations. These effects included degraded PR sensitivity, increased footprint size, and mismatched transmission and reception angles for one pulse among onboard averaging pulses. As a result, there were slight changes in PR reflectivity and rainfall estimation (Short and Nakamura, 2010). The limitations of PR measurements prevent more thorough and detailed studies (Nan Li et al., 2019):
Due to TRMM's limited orbital inclination, PR could not observe rainfall in extratropical regions.
Due to PR's minimum detectable reflectivity at the Ku band (18 dBZ), it is unable to detect light rain, snow, or non-precipitating clouds, which impacts precipitation analysis, monitoring, and prediction.
The lack of raindrop shape and phase state data from PR hindered the understanding of cloud and precipitation microphysics.
TRMM had a low temporal resolution due to its narrow field of view and limited number of passes over a specific region per day. Rainfall observations experienced temporal sampling errors due to this (Lida et al., 2010).
The convective rain significantly attenuated, which could not be totally addressed by attenuation correction algorithms due to PR operating at the Ku band (Liao and Robert Meneghini, 2009).
The radar beam broadening of PR was significant because of the high satellite altitude and a coarse resolution of 5 km at the nadir. These conditions often resulted in partial beam filling for rainfall observation, which introduced uncertainties for reflectivity and precipitation products (Kozu et al., 1998).
The weakness of PR observations can be overcome or partly overcome by the implementation of the Global Precipitation Measurement (GPM) mission (Yang et al., 2015).
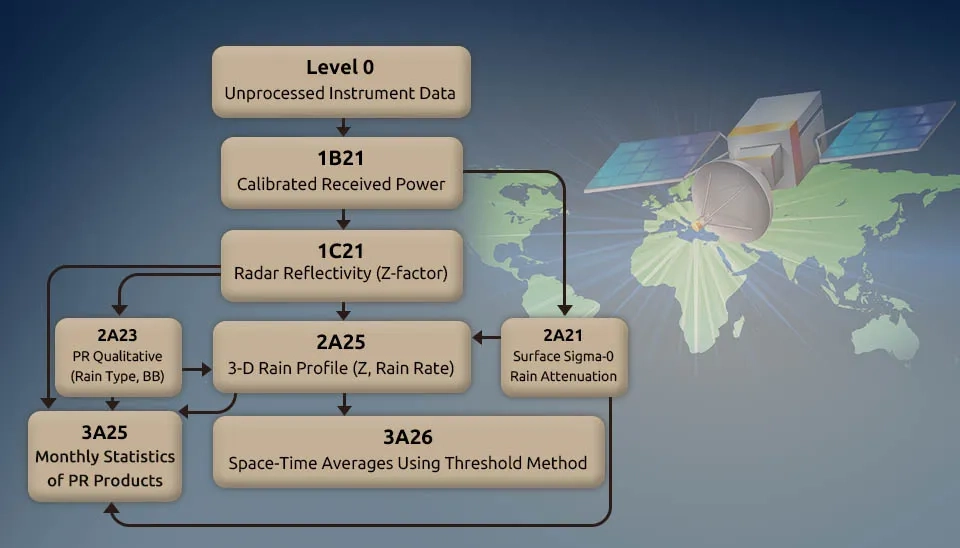
1.1.5. PR Instrument’s Products
The TRMM science team classifies the TRMM PR standard algorithms into three main levels:
Level 1: 1B21, 1C21
Level 2: 2A21, 2A23, 2A25, 2H25
Level 3: 3A25, 3A26
Level 1 and Level 2 products are data in the Instantaneous Field Of View (IFOV), and Level 3 data give the monthly statistical values of rain parameters (Nan Li et al. 2019), mainly in 5° x 5° grid boxes required by the TRMM mission (JAXA). During the orbit-raising period (7–24 August 2001), no data was recorded (JAXA).
Fig. 5. The data processing flow for the TRMM Precipitation Radar, showing the steps from raw data to monthly statistical products.
1.2. TRMM Microwave Imager (TMI)
TMI was a nine-channel conical scanning microwave radiometer with an offset parabolic reflector, observing at an angle of approximately 49° from the nadir, and conducting an azimuthal rotation scan of around 130° over the Earth's surface (Kummerow et al. 1998). The design was based on the Special Sensor Microwave Image (SSM/I) (Hollinger et al., 1990). TMI provides rain rate, column water vapor, cloud liquid water, etc. (Kondo et al., 2006), horizontal and vertical polarizations at 10.7, 19.4, 37.0, and 85.5 GHz, and only vertical polarization at 21.3 GHz (Furuzawa and Nakamura, 2005).
1.2.1. Mission Overview of TRMM sensor (TMI)
The TMI, with heritage from DMSP SSM/I, operates at multiple frequencies and provides rainfall data across a wide geographic region. The TMI provides information on the integrated column precipitation content, cloud liquid water, cloud ice, rain intensity, and rainfall types (e.g., stratiform or convective). TMI is not a new instrument. TMI, designed after the successful SSM/I, is known as the "workhorse" for measuring rainfall on the Tropical Rainfall Measuring Mission, due to its extensive coverage and accuracy of data. The passive TRMM Microwave Imager (TMI) instrument, aside from providing the highest-resolution data available to date, has also been used to derive sea surface temperature by a number of investigators (e.g., Wentz et al., 2000).
1.2.2. Objectives of TMI
The primary mission objectives of the TRMM Microwave Imager (TMI) include the measurement of surface precipitation intensity—both in liquid and solid phases—and the estimation of near-surface wind speeds over the ocean. These observations, as noted by WMO OSCAR, are essential for improving understanding of tropical rainfall systems, air–sea interactions, and their role in global climate dynamics.
1.2.3. Characteristics of Sensor
Sensor characteristics (TRMM Data Users Handbook, 2001, JAXA, WMO OSCAR):
Satellites this instrument is flying on: TRMM
Purpose: Multi-purpose imagery, with emphasis on precipitation
Observation Frequency: 10.65, 19.35, 21.3, 37 and 85.5 GHz
Coverage/Cycle: Intertropical coverage consists of several sequences of passes occurring at approximately 100-minute intervals, with longer gaps occurring once or twice each day. More regular coverage at 15°N and 15°S
1.2.4. TMI Instrument’s Performance
TMI is not a new instrument; it is based on the design of the Special Sensor Microwave/Imager (SSM/I), which has been flying continuously on Defense Meteorological Satellites since 1987. The TMI measures the intensity of radiation at five separate frequencies: 10.7, 19.4, 21.3, 37, and 85.5 GHz. These frequencies are similar to SSM/I, with an additional 10.7 GHz channel for high tropical rainfall rates. The other main improvement that is expected from TMI is due to the improved ground resolution. This improvement, however, is not the result of any instrument improvements but rather a function of the lower altitude of TRMM (250 miles/402 kilometers) compared to 537 miles (860 kilometers) of SSM/I. TMI has a 547-mile (878-kilometer)-wide swath on the surface. The higher resolution of TMI on TRMM, as well as the additional 10.7 GHz frequency, make TMI a better instrument than its predecessors (NASA).
TMI utilizes microwave signals across 5 channels for horizontal rainfall distribution measurements. TMI has a wider swath width compared to PR and employs microwave signals for rainfall measurements. TMI can quantify rainfall over the ocean but faces challenges in accurately measuring land rainfall (JAXA).
1.2.5. TMI Instrument’s Products
TMI products are shown in Table 2 (TRMM Data Users Handbook, 2001; Zhong Liu et al., 2012).
Table. 2. TMI Products
Description
Level
TMI brightness temperatures, to which radiometric and geometric
correction is carried out.
1B-11
The TMI rain profile consists of several physical parameters, such as precipitation water, cloud water, cloud ice, precipitation ice, and latent heating.
2A-12
TMI monthly oceanic rainfall, which is monthly accumulated rainfall on 5°
x 5° grid.
3A-11
TMI monthly mean 2A11, profile and surface Rainfall on 5°
x 5° grid
3A12
1.3. Visible Infrared Scanner (VIRS)
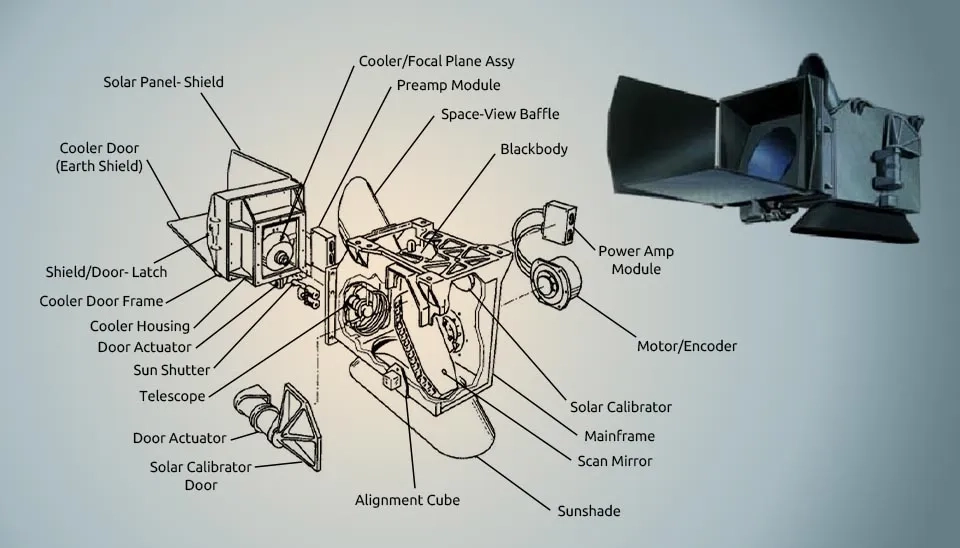
The third rain instrument on the TRMM, in addition to PR and TMI, is a five-channel VIS/IR (VIRS) sensor with bands in the wavelength range from 0.6 to 12 μm (Guan et al., 2003). The VIRS measured cloud-top temperatures and structures. Although the direct precipitation data obtained from VIRS can be less reliable than the information obtained by microwave sensors, VIRS serves an important function by linking the infrequent but accurate TMI and PR observations with the more abundant and longer time series data from geostationary VIS/IR satellites. Figure 6 describes the VIRS instrument graphically. According to figure 6, for each of the five channels, the optics feature a scan mirror that is designed as a double-sided paddle wheel; two radiative cooler windows; a cold focal plane with a spectral filter; an 8.9-cm-diameter Cassegrain telescope; a detector element; and a planar lens (Kummerow et al. 1998).
Fig. 6. An exploded-view diagram showing the components of the Visible and Infrared Scanner (VIRS) instrument from the TRMM satellite.
1.3.1. Mission Overview of TRMM sensor (VIRS)
The VIRS is similar to instruments flown on other NASA and NOAA meteorological satellites. VIRS compares five channels: three in the thermal infrared, one in the visible, and one in the near-infrared. The center wavelengths are 0.6, 1.6, 3.8, 10.8, and 11.9 μm (Inoue and Aonashi, 2000). VIRS data is an important part of algorithms that estimate rain. These algorithms are mostly based on passive and active microwave sensors, which act as background imagers and give passive microwave and radar observations cloud context. The comparison of microwave data with VIRS visible and infrared data is likely to lead to a more accurate estimation of precipitation than using visible and infrared data alone (TRMM Data Users Handbook, 2001).
1.3.2. Objectives of VIRS
The VIRS mission objectives are as follows (WMO OSCAR, NASA):
Sea surface temperature
Cloud coverage
Cloud top height
Cloud type
Cloud top temperature
ability to delineate rainfall
1.3.3. Characteristics of Sensor
Sensor characteristics (TRMM Data Users Handbook, 2001, JAXA, WMO OSCAR):
Satellites this instrument is flying on: TRMM
Developer: Goddard Space Flight Center
Observes: Cloud distribution
Frequencies: 0.6, 1.6, 3.8, 10.8, and 11.9 μm
Swath Width: Scan angle ± 45 degrees, 720 km at ground
Scanning Technique: Cross-track, 256 pixel, 1.6 km s.s.p
Horizontal resolution: 4.3 km
Scan Angle: 360 degrees
Rotation Rate: 98.4 rpm
Optics: Cassegrain optics
Data Rate: 50 kbps (Daytime)
Weight: 40 kg
Power: 53 W
Utilization Period: 1998–2015
Coverage/Cycle: Intertropical coverage consists of several sequences of passes occurring at approximately 100-minute intervals, with longer gaps occurring once or twice each day. More regular coverage at 15°N and 15°S
1.3.4. VIRS Instrument’s Performance
VIRS, as the primary instrument package, is able to delineate rainfall and serve as a transfer standard for other measurements using POES and GOES satellites. The source's brightness or temperature can be determined by the radiation intensity in the bands (NASA).
VIRS measures the rainfall rate using an estimate of the cloud height and characteristics (JAXA).
1.3.5. VIRS Instrument’s Products
The VIRS data will be used to study precipitation using visible and IR techniques. It will, in addition, provide a link between the derived precipitation and similar data, both historical and contemporaneous, from geosynchronous and low-earth orbiting sensors (Kumerow et al. 1998).
The VIRS data product is 1B01 (radiance), to which radiometric and geometric corrections are carried out. IB-01 data is used for geolocation and calibration for VIRS Level 1A products. The output of 1B01 is used for 3B42 (TRMM Data Users Handbook, 2001).
1.4. Clouds and the Earth’s Radiant Energy System (CERES)
Clouds and the Earth's Radiant Energy System (CERES) is an instrument with the purpose of evaluating the role of cloud/radiation feedback in the Earth's climate system. The CERES instrument is a new design based on the successful ERBE scanning radiometer (Wielicki et al., 1996), with several improvements to accommodate upgraded performance requirements and hardware developments.
1.4.1. Mission Overview of TRMM sensor (CERES)
CERES has five instruments flown on multiple satellites, starting with TRMM. It was then used on the Terra satellite in 1998 and the Aqua satellite in 2000. The CERES satellite missions aim to establish a detailed record of precise energy budgets and cloud data for improved climate analysis. CERES also measured cloud properties, including the size of the cloud particles, cloud amount, thickness, and altitude (NASA). On May 29, 2001, because of an instrument anomaly, CERES was turned off (Tomomi Nio et al., 2015).
Coverage/Cycle: Global coverage twice/day (IR and total radiance) or once/day (short-wave)
Utilization Period: 1998 to 2027
1.4.4. CERES Instrument’s Performance
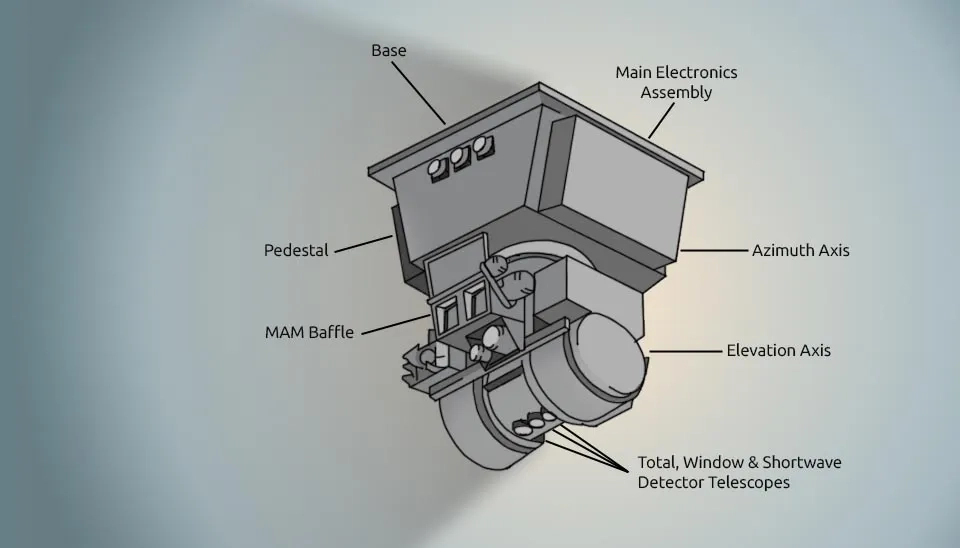
The CERES instrument calculates the total radiant energy balance, measuring energy at the top of the atmosphere and at the Earth's surface. It also determines cloud properties using high-resolution cloud imaging instruments on the same spacecraft (Wielicki et al., 1996). Advancing our understanding of the Earth's climate system requires these critical measurements. There are three channels in the CERES instrument (Fig. 5), and it uses precise thermistor bolometers to take very accurate and stable radiometric measurements (Cooper et al., 1992). All TRMM sensors functioned well for many years, except for CERES, which had issues in the early stages (Nakamura, 2021).
Fig. 7. A detailed view of the CERES instrument, including its detector telescopes, main electronics assembly, and mounting components.
1.4.5. CERES Instrument’s Products
The CERES instrument onboard TRMM measured the Earth's radiation budget and atmospheric radiation from the Top Of the Atmosphere (TOA) to the surface. Its output products include cloud properties, top-of-atmosphere radiative fluxes, atmospheric radiative fluxes, angular-dependence models of solar and thermal infrared radiation, and surface radiative fluxes (Wielicki et al. 1996).
1.5. Lightning Imaging Sensor (LIS)
Lightning is a worldwide occurrence that can help us measure certain aspects of global change. Lightning activity is linked to thunderstorms, making it a valuable resource for studying rainfall patterns and the behavior of storms worldwide and, therefore, can be used to increase our knowledge of the distribution, structure, and variability of thunderstorms at the local, regional, and global scale over the land and ocean . Lightning measurements provided by the Lightning Imaging Sensor (LIS) on the RMM can help researchers develop algorithms to examine the electrical, microphysical, and kinematic characteristics of tropical thunderstorms (intracloud versus cloud-to-ground discharges) and frequency of lightning, which are intimately related to the microphysical (e.g., ice mass, liquid water content) and kinematic properties (e.g., updraft speed) of thunderstorm systems and to the environment (e.g., available buoyant energy) (Christian et al., 2000).
1.5.1. Mission Overview of TRMM Sensor (LIS)
Updraft activity and the development of precipitation tightly control the processes that result in the production of lightning. Lightning is closely associated with the formation of cloud mass and ice in thunderstorms. Lightning activity follows the updraft, increasing as it intensifies and decreasing when vertical growth stops. The ability to identify and quantify convective core regions through lightning detection from space makes LIS a valuable tool in TRMM (Christian et al. 2000).
The groundwork for modern space-based lightning detection began in the 1970s through several experiments that recorded lightning waveforms from above the cloud top (Vorpahl et al., 1970; Sparrow and Ney, 1971; Orville and Spencer, 1979). A wide field-of-view Optical Pulse Sensor (OPS) and several instruments were put on a NASA U2 plane to study the statistical properties of lightning cloud-top optical emissions (Christian and Goodman, 1987).
Further insight into the optical characteristics of lightning seen from space can be obtained using the TRMM Lightning Imaging Sensor (Christian and Coauthors, 1999). The instrument gathered global data for over 17 years and served as the main data source for the aforementioned total lightning studies.
The LIS instrument consists of an imaging system, a focal plane assembly, a real-time signal processor and background remover, an event processor and formatter, a power supply, and interface electronics (Christian et al., 1999).
LIS provides a wealth of information and finer resolution (approximately 4 km × 4 km), making it a valuable resource for comprehending the Geostationary Lightning Mapper (GLM) data. Moreover, the LIS flight spare for TRMM is now onboard the International Space Station (ISS) to expand the limited latitudinal observation by TRMM LIS to about ±55° (Blakeslee and Koshak, 2016).
1.5.2. Objectives of LIS
The goal of its design is to detect weak optical lightning pulses during the day, despite the much stronger sunlight reflected off cloud tops. LIS achieves this aim by detecting lightning-generated optical emissions from the 777.4 nm atomic oxygen line (Bitzer and Christian, 2015).
1.5.3. Characteristics of Sensor
The characteristics of the sensor are detailed in the TRMM Data Users Handbook (2001), as well as in sources from JAXA, WMO OSCAR, and Christian et al. (1992).
Satellites this instrument is flying on: TRMM
Observation band: 0.777655 μm
Horizontal Resolution: 4 km (nadir)
Data Rate: Ave. 6 kbps
array size: 128*128
Swath Width: ~ 600 km
Weight: 18 kg
Power: 42 W
Coverage/Cycle: On TRMM: several passes at ~100-min intervals with longer gaps once or twice per day. More regular coverage at 15°N and 15°S
Utilization Period: 1998–2015
1.5.4. LIS Instrument’s Performance
LIS uses a 128 × 128 pixel array to provide a field of view on the ground of about 600 km × 600 km; each pixel has a footprint of 4.5 km. Due to its low-Earth orbit, TRMM allows LIS to observe a specific ground point for around 90 s. Comparisons with ground-based data indicate that LIS has an overall flash detection efficiency of approximately 70% during peak cloud-top brightness and around 88% at night (Boccippio et al., 2002). If the optical emission in a single pixel exceeds a specific threshold, LIS considers it an event. Events in adjacent pixels within a single frame are grouped together, roughly representing a lightning stroke. The LIS group location that is reported is the radiance-weighted centroid of the constituent events. Groups that occur within 330 ms and 5 km are classified as belonging to the same flash (Christian et al., 2000; Mach et al., 2007).
1.5.5. LIS Instrument’s Products
The Lightning Imaging Sensor (LIS), an optical satellite instrument for the detection and location of lightning events in the Earth's atmosphere, offers high-resolution lightning data critical to atmospheric convection, severe weather, and climate research. The LIS science data products include precise time, location, and energy of the observed lightning flashes from orbit. These data are available at no charge from NASA's Global Hydrology Resource Center (GHRC) and include both near real-time and reprocessed orbital lightning products (Zhong Liu et al., 2012). These products can be accessed by scientists to support a range of meteorological, hydrological, and climatological applications.
2. Conclusion
TRMM, utilizing its instruments, facilitated the development of studies of global precipitation system climatology and precipitation measurement technology from space. With five instruments, including a three-sensor rainfall suite (PR, TMI, and VIRS) and two related instruments (LIS and CERES), TRMM provided a unique 17-year dataset of tropical rainfall and lightning around the world. TMI was the only passive microwave instrument in an inclined orbit, and PR is the sole rain radar in space. VIS channels may also serve to improve TRMM rain estimates via pattern recognition techniques. These three rain instruments provide the most comprehensive rain data, which is crucial for climate modeling and severe storm analysis. CERES and LIS flew on board TRMM as instruments of opportunity for the Earth Observation System Program. The CERES instrument measures the Earth's radiation budget, and the LIS instrument investigates the global distribution of lightning. TRMM sensors have performed very well, except for CERES.
The Tropical Rainfall Measuring Mission (TRMM) Instruments | Waterlyst


Comments
No comments yet
Be the first to comment
Share your thoughts and start the conversation.