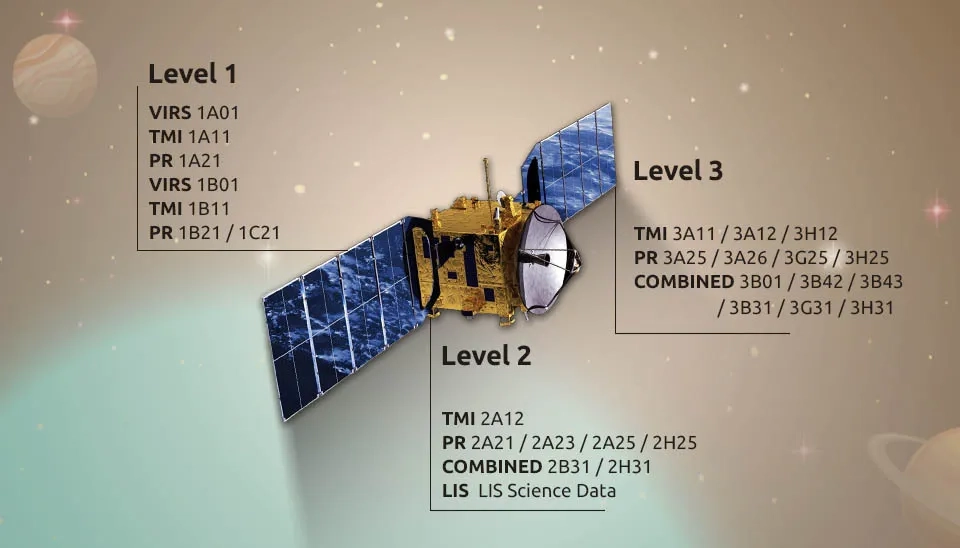
The Tropical Rainfall Measuring Mission (TRMM) Products
TRMM, a joint mission of NASA and NASDA, was launched in November 1997 to study tropical rainfall and energy release. The TRMM Science Data and Information System (TSDIS) handles the processing of all TRMM standard products.
TRMM, a joint mission of NASA and NASDA, was launched in November 1997 to study tropical rainfall and energy release. The TRMM Science Data and Information System (TSDIS) handles the processing of all TRMM standard products. The Goddard Earth Sciences Distributed Active Archive Center (GES DAAC) is responsible for archiving and distributing standard products to general users and provides derived TRMM products, such as subsets and GIS-compatible files, to enable easier utilization of the data by the general public (Rui et al. 2003). The Precipitation Processing System (PPS) is responsible for processing data and providing scientific information for TRMM, while the Earth Observing System Data and Information System (EOSDIS) is the long-term storage system for all TRMM data products (File Specification for TRMM Products, 2017).
Table. 1. TRMM Standard Products | TRMM Products
Level
Instrument
Name
Output Product
1
VIRS
1A01
Reconstructed, unprocessed data (VIRS data)
TMI
1A11
Reconstructed, unprocessed data (TMI data)
PR
1A21
Reconstructed, unprocessed data (internal data)
VIRS
1B01
Radiance
TMI
1B11
Brightness Temperature
PR
1B21
Calibrated Received Power
1C21
Radar Reflectivity
Click this link to see the full specification table
Fig. 1. Tropical Rainfall Measuring Mission (TRMM) products organized by processing level and instrument.
1. Overview of Operation TRMM Data
TRMM data goes through the following steps from the receiving stage to the processing stage and delivery to users (Tomomi Nio et al. 2015):
The White Sands station receives TRMM data in the Consultative Committee for Space Data Systems (CCSDS) packet format via the Tracking and Data Relay Satellite System (TDRSS).
The raw data was transmitted from White Sands, New Mexico, to the Sensor Data Processing Facility (SDPF) at Goddard Space Flight Center (GSFC), where it was processed into level 0 raw binary data.
SDPF produces daily level 0 raw files (in the case of PR, it creates 4 6-hour raw files). The daily data is transmitted to TSDIS for scientific processing.
TSDIS began generating near-real-time data after 2000, and PPS processed and shared it with users. Near-Real Time (NRT) data included VIRS radiances; TMI brightness temperature products and rain retrievals; and PR reflectivity, rain type, and 3-D precipitation products.
PPS processed level 0 files from TMI, VIRS, and PR to level 1, 2, and 3 products. PPS distributed these data to users and sent products to the GSFC EOS Data and Information System (EOSDIS) Distributed Active Archive Center (DAAC) for long-term archive and support.
Level 0 processed CERES is transmitted to the Langley Research Center EOSDIS DAAC, and LIS data is transmitted to the Marshall Space Flight Center EOSDIS Global Hydrology Research Center (GHRC) DAAC. These EOSDIS DAACs are responsible for processing all of the data from these instruments.
PPS successfully delivered PR Level 0 data and the accompanying ephemeris files to Japan. The JAXA Earth Observation Center (EOC) in Japan then performs higher-level processing of PR.
1. Overview of the TRMM Products
TRMM data are presented in five levels (levels 0 to 4), which indicate the processing done at different stages after receiving the raw data from GSFC. NASA and NASDA process the observed data from TRMM and distribute it to users. Table 2 displays the definition of TRMM products (Christian et al., 1992 ; TRMM Data Users Handbook, 2001; Rui et al., 2003).
Table. 2. The definition of the TRMM products
Level
Definition
0
Level 0 data products are raw instrument data at original resolution, time-ordered, and quality-checked, and there is no redundancy with duplicates removed from the satellite.
1
Level 1 data products are made up of level 0 data products that include location information and extra data, and they are converted into specific physical units based on the sensor, like brightness temperatures from the TRMM Microwave Imager (TMI), calibrated radiances from the Visible/Infrared Scanner (VIRS), and return power and reflectivities from the Precipitation Radar (PR).
2
Meteorological measurements (such as rainfall rate, latent heat, and cloud liquid water) obtained from Level 1 data through different algorithms with the same location and resolution will be generated as a map in 2D or 3D.
3
The outcomes of meteorological parameter mapping (Level 2) are presented on a consistent spatial and temporal grid.
4
Merging measurements from TRMM and other sources allows for their analysis or production.
Level 1 consisted of 1A and 1B products, containing raw data and geolocated products, respectively, while PR had a 1C product that provided geolocated radiances at Instantaneous Field Of View (IFOV) in TRMM orbits (Tomomi Nio et al. 2015).
2. Versions of the TRMM Products
Throughout its 17 years of operation, the Tropical Rainfall Measuring Mission (TRMM) has had 7 data product versions, as listed in Table 3. Although the initial three versions were restricted to instrument calibration and were not released, they still processed mission data from the instrument turn-on date. The first publicly released version, version 4, provided a consistently processed mission dataset. The TRMM satellite's end led to the closeout phase (phase F), involving the final reprocessing of its data. This reprocessed data, known as version 8, is now part of the GPM data suite and identified as version 05 (Stocker et al. 2018).
Table. 3. TRMM Data Product Versions (Tomomi Nio et al., 2015; Rui et al., 2003; GES DISK)
Product Version
Temporal Coverage
Release Date
1
Launch: 02/28/1998
12/09/1997
2
Launch: 05/31/1998
3
Launch: 08/31/1998
4 (level 1, 2 and 3)
Launch: 10/31/1999
08/29/1998
5
Launch: 08/06/2001
11/04/1999
6
December 1997–June 2011
04/14/2004
7
Launch: 04/08/2015
07/20/2011
Latent heat (SLH)
Launch: 04/02/2015
2. Format and TRMM File Name
The National Center for Supercomputing Applications created the Hierarchical Data Format (HDF) for the purpose of sharing scientific data in a distributed environment, which includes platform independence, support for scientists' commonly used data and metadata types, efficient storage of and access to large data sets, the ability to support future improvements, and compatibility with standard formats (TRMM Data Handbook, 2001). TRMM data is archived in HDF4 format. TRMM, prior to version 8 reprocessing, utilized a specific four-character alphanumeric identifier for each of its products For example, consider the data type labeled 2A23:
1) The first character (2) denotes level 2 processing (geophysical parameter);
2) The second character (A) denotes data from a single instrument (level 1 products are the exception, as A indicates a count product and B a radiance-Tb product);
3) The third character (2) denotes data comes from PR (letter to indicate whether data are from a single sensor or multiple sensors, number to indicate which instrument (0–VIRS, 1–TMI, 2–PR, 3–multiple); and
4) The fourth character (3) indicates the third product made with PR data (i.e., rain types) (number to indicate which product for that particular instrument ). After version 8, TRMM data products are renamed using GPM conventions as they become part of the GPM data suite (Stocker et al. 2018).
3. Types of Products
TRMM standard products have been publicly available since a few months after their launch in November 1997. According to Stocker et al. (2007), standard products fall into three categories:
Single TRMM instruments: Visible Infrared Scanner (VIRS), TRMM Microwave Imager (TMI), and Precipitation Radar (PR).
The single TRMM instrument products are processed through four levels:
Level 1A: science data packets processed into orbital files
Level 1B and 1C: geolocated data at the instrument field of view
Level 2: geolocated geophysical parameters at the instrument field of view
TRMM and other satellites: These products include combined products and Special Sensor Microwave/Imager (SSMI), the Advanced Microwave Scanning Radiometer for EOS (AMSRE), and the Advanced Microwave Sounding Unit (AMSU) satellite data.
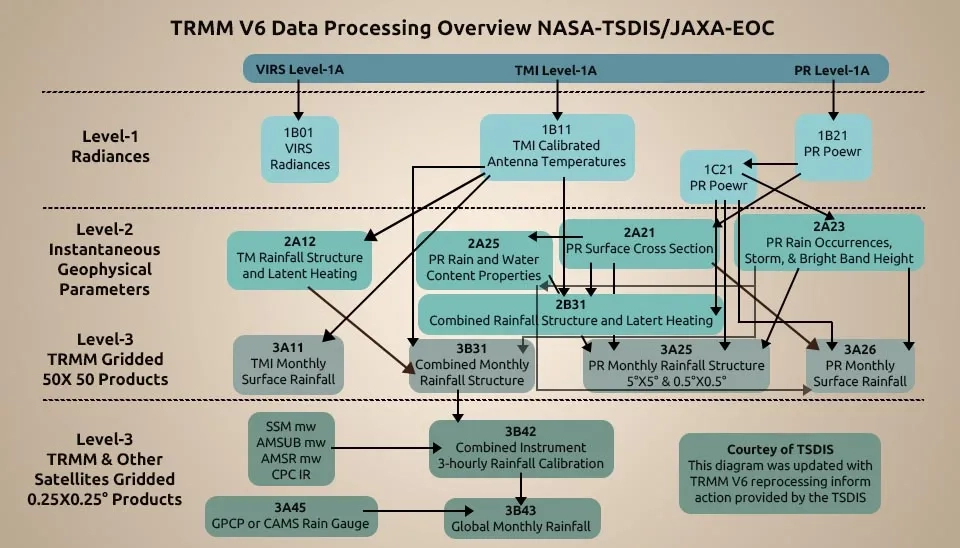
Huffman et al. from the GSFC Laboratory for Atmospheres and the TSDIS have developed a new Experimental TRMM Real-time Multi-satellite Precipitation Data Set, which is now available to everyone. These are categorized as 3B40RT, 3B41RT, and 3B42RT (Rui et al. 2003). NASDA provides TRMM data products, as shown in Table 1 (TRMM Data Users Handbook, 2001; Zhong Liu et al., 2012; Tomomi Nio et al., 2015; Liang and Wang, 2020 ). There are several data services For downloading this data.
Fig. 2. TRMM V6 data processing overview, outlining the flow from VIRS, TMI, and PR instruments to final products.
3.1. Precipitation Radar (PR) Products
The presence of a precipitation radar (PR) sets TRMM apart. Prior to TRMM, space-based rain radar did not exist, and global precipitation monitoring relied on visible and infrared radiometers on geostationary or polar-orbiting satellites (Furuzawa and Kenji Nakamura, 2005).
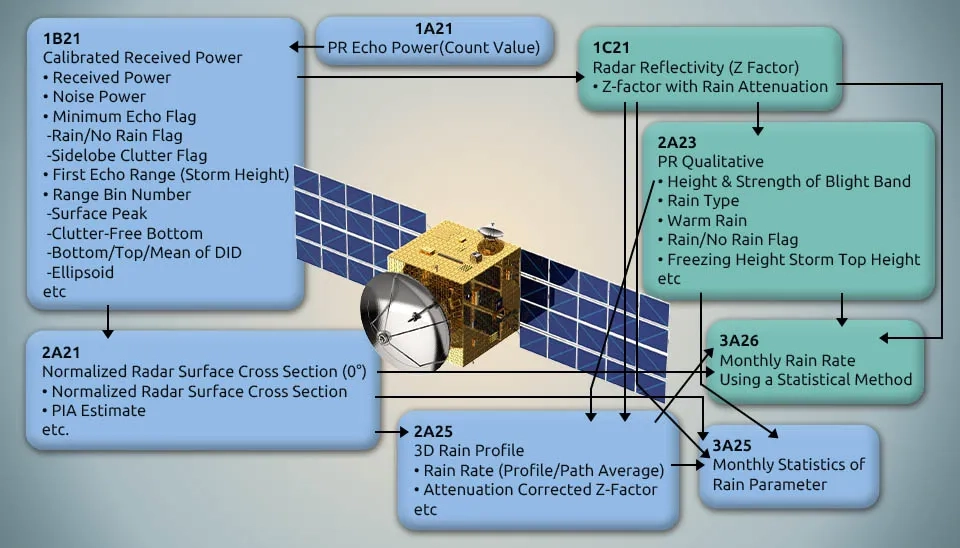
The PR standard products are categorized into three levels: 1) Level 1 (1B21, 1C21), 2) Level 2 (2A21, 2A23, 2A25, 2H25), and 3) Level 3 (3A25, 3A26). Level 1 and Level 2 products include data within the Instantaneous Field Of View (IFOV), whereas Level 3 products provide monthly statistical rain parameter values (Nan Li et al. 2019). Processing carried out at each level is explained hereafter (TRMM Data Users Handbook, 2001; Okamoto and Kozu, 1993):
3.1.1. PR Level 1 processing
The PR Level 1 processing involves verifying whether the NASA-transmitted Level 0 data is in observation mode, followed by processing and including appended geolocation information for three types of products: 1A21, 1B21, and 1C21. We also conduct calculations for the received power, noise level, and the Z factor, which accounts for rain attenuation.
3.1.2. PR Level 2 processing
Three product types (2A21, 2A23, 2A25, and 2H25) are processed in PR Level 2, determined by Level 1 processing results, and involve calculating parameters like normalized radar surface cross section, height of the bright band, Z factor correcting rain attenuation, rain type, 3D profile of rain rate, and others.
3.1.3. PR Level 3 processing
PR Level 3 processing categorizes products as 3A25 and 3A26, depending on level 1 and 2 processing results. The monthly averaged rain rate is then calculated for the 5° x 5° grid mesh and the 0.5° x 0.5° mesh in 3A25. The results of Level 3 processing offer valuable monthly statistics on rain distribution, which are particularly useful for obtaining statistical values.
Fig. 3. TRMM Precipitation Radar (PR) algorithm flowchart, detailing the outputs at each processing level.
3.2. TMI Products
By measuring microwave energy, it quantifies water vapor, cloud water, and rainfall intensity in the atmosphere (Simpson et al. 1999). TMI is a multichannel, dual-polarized MWR that provides data related to rainfall rates over the oceans. The TMI data, together with the PR data, were the primary dataset for precipitation measurements. The TMI data combined with the PR and VIRS data were also used to derive precipitation profiles (Liang and Wang, 2020).
3.2.1. TMI Level 1 processing
It will be given as a single-sample Effective Field Of View (EFOV) with calibrated microwave brightness temperatures and cross-polarization fixed (Kummerow et al. 1998), which is level 1B TMI data. Product 1B-11 performs geolocation and calibration for TMI Level 1A data.
3.2.2. TMI Level 2 processing
Separate algorithms are employed in the TRMM 2A12 data product for land, ocean, and coastal regions due to the distinct microwave emission properties of each surface type. Microwave frequencies detect a radiometrically cold and strongly polarized ocean surface at low and moderate wind speeds. Thus, it is simple to distinguish between the warm, randomly polarized emission from rainfall and the emission from the ocean surface. Land surfaces, on the other hand, show little polarization and are radiometrically warm. Thus, the decrease in 85-GHz brightness temperature (Tb) caused by ice scattering is mainly utilized to gauge land rainfall. In addition, land surfaces are usually very nonhomogeneous and can have highly variable surface emissivity. In contrast to the TMI ocean algorithm, the TMI land rainfall algorithm relies on empirically derived Tb-rain-rate relationships rather than physically based radiative transfer modeling of rainfall (Gopalan et al. 2010).
3.2.3. TMI Level 3 processing
Using TMI data, the algorithm for product 3A11 generates monthly oceanic rainfall maps for 5° x 5° boxes, using brightness temperature (Tb) data from 1B11 as input. It is based on the technique developed by Wilheit et al. (1991). The first step is to apply a land mask filter to the TMI Tb data, eliminating any potential land contamination. Next, the oceanic Tb data is accumulated to generate monthly brightness temperature histograms. The rain layer thickness is then determined based on the upper 99th percentile of the respective Tb histograms at 21.3 and 19.35 GHz. By matching the observed brightness temperature histogram with a mixed lognormal rain rate distribution via the R-Tb relationship, the parameters of the distribution can be calculated. Calculating the monthly mean rain accumulation (mm/month) involves multiplying the fractional rain by the conditional rain rate. (Simpson et al. 1999).
3.3. VIRS Products
The TRMM Visible and Infrared Scanner (VIRS) has only two products: a level 1A product that contains the instrument counts in packed format and a level 1B radiance product that has geolocated instrument Field-Of-View (FOV) radiances for each of its channels (Stocker et al. 2018). IB-01 data is used for geolocation and calibration for VIRS Level 1A products.
Table. 5. TRMM VIRS Products
Description
Level
Reconstructed, unprocessed VIRS data
1A01
VIRS Radiance, to which radiometric and geometric correction is carried out
1B01
3.3.1. VIRS Level 1 processing
For VIRS, the level 1B output will include pixels with band-centered spectral radiance values for each channel, registered spatially and located geometrically. To determine the system gain (counts/radiance) for each channel, the solar radiance from the diffuser for channels 1 and 2 will be calculated. This calculation will be done by considering the count difference observed at the diffuser and space view, along with the calculated radiance. The gain will then be divided by the count difference for each earth view pixel, converting the counts to radiance. The spectral radiance for channels 3, 4, and 5 will be calculated using the onboard blackbody's temperature and emissivity. Adjustments will be made for radiance reflected off the blackbody and into the VIRS from the scan cavity. These radiance values, like those for channels 1 and 2, will be used with the count difference between the blackbody and space view to generate gains for converting earth view counts to radiance. The thermal band gains will be recalculated for each scan line, unlike the weekly to monthly updates for the reflected solar band gains (Kummerow et al. 1998).
3.4. CERES Products
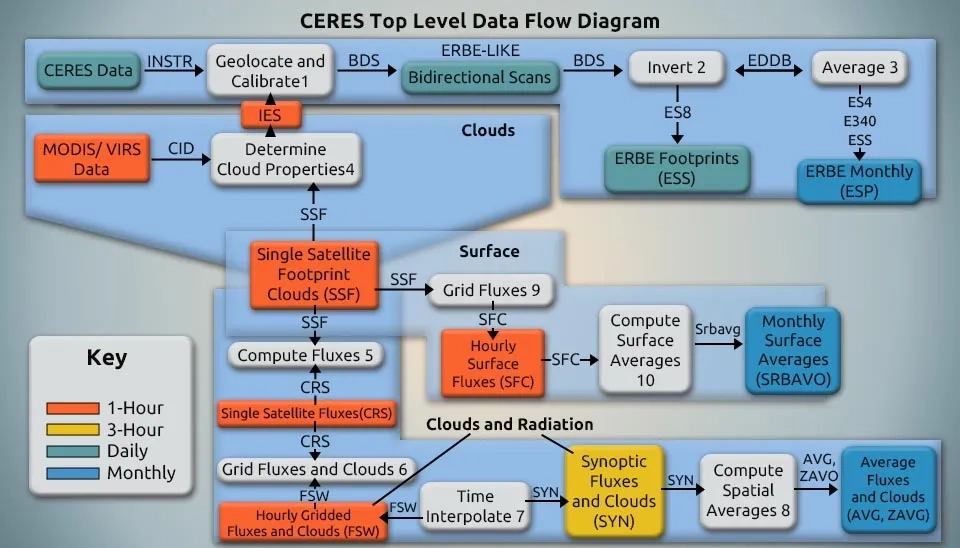
Using radiometers, CERES makes Top-Of-Atmosphere (TOA) measurements of reflected and earth-emitted radiation in three broadband channels: a shortwave (SW) channel (0.2–5.0 μm), a total channel (from 0.2 to >100 μm), and a thermal infrared (IR) window channel (8–12 μm) (Gupta et al. 2010). Three parameterization algorithms are used to estimate surface broadband shortwave and longwave irradiances within CERES instrument footprints, supplementing the CERES satellite observations (Kratz et al. 2010, Kratz et al. 2020). By utilizing EOS narrowband imagers, CERES will integrate cloud property data to produce unified cloud/radiation data consisting of shortwave (SW) and longwave (LW) radiative fluxes at the surface and at several selected levels within the atmosphere (Wielicki et al. 1996). The simplest way to understand the structure of the CERES data analysis algorithms is to examine the CERES data flow diagram shown in Figure 2 (The CERES Science Team, 2000).
Fig. 4. CERES top-level data flow diagram, illustrating the processing from raw instrument data to final products.
3.4.1. CERES Level 1 Processing
The latest CERES gains are used to convert raw digitized instrument data (Level 0) to instantaneous filtered radiances (Level 1) (Thomas et al. 2010). Then, time-dependent spectral response function values are utilized to correct for instrument spectral response. Correcting for the instrument's imperfect spectral response involves using time-dependent spectral response function values and converting filtered radiances into unfiltered SW, LW, and window (WN) radiances (Loeb et al., 2001; Loeb et al., 2016).
Level 1B product, namely BDS with number CER01, known as Bi-directional Scan Filtered Radiation. Instantaneous filtered broadband radiances at the CERES footprint resolution, geolocation and viewing geometry, instrument status data, satellite position and velocity, and all raw engineering and solar geometry (Data Quality Summary V2, 2023).
3.4.2. CERES Level 2 Processing
The CERES L2 Single Scanner Footprint (SSF), TOA/Surface Fluxes, and Clouds data products provide parameterized surface fluxes reported with TOA satellite observations, with Model B being the most notable algorithm. Model B, also known as the all-sky Langley Parameterized SW and LW Algorithms (LPSA and LPLA) (Scott et al., 2022). In addition, Models A and C have been developed. Using Model A, surface flux parameterizations process the CERES SSF (Li and Garand 1994; Inamdar and Ramanathan 1997), which calculates fluxes in clear-sky footprints only, and Model C (Zhou and Cess 2001; Zhou et al. 2007), which was recently incorporated into the CERES processing stream (Kratz et al. 2020) and calculates LW fluxes only. Using the NASA Langley Fu–Liou radiative transfer model, the Cloud Radiative Swath (CRS) data product creates the standard Single Scanner Footprint (SSF) data product by calculating various radiative fluxes from the surface to the top of the atmosphere at the momentary CERES footprint level (Scott et al., 2022).
Table. 7. The CERES level 2 products (TRMM data user handbook, 2001; Wielicki et al., 1995 )
Number
Name
Definition
Frequency
CER02
ES-8
ERBE (Earth Radiation Budget Experiment)—like Surface Flux Estimate and Instantaneous TOA (top of atmosphere)
1/day
CER04
CRS
Single satellite CERES footprint, Cloud Radiative Swath (surface flux, internal atmosphere flux, TOA flux) (SARB modeling method)
1/hour
CER11
SSF
Single Satellite Flux is produced from the cloud identification, inversion, and surface processing for CERES. (FOV radiance, clear area radiance, cloudy area radiance and cloud properties)
1/hour
3.4.3. CERES Level 3 Processing
Consistency with known constraints is maintained by adjusting level 3 data products within their range of uncertainty (e.g., consistency between average global net TOA flux imbalance and ocean heat storage) (Data Quality Summary V2, 2023). To determine the monthly average fluxes (level 3), first, the spatial average of instantaneous TOA flux values is obtained in a 1°×1° grid. Then time interpolation is done between the observed values with 1-hour increments for each hour of each month, and then the averaging of all hour boxes in one month is done (Doelling et al. 2013).
Table. 8. The CERES level 3 products (TRMM data user handbook, 2001; Wielicki et al. 1995 )
Number
Name
Definition
CER03
ES-9
ERBE-like Monthly Regional Averages (Source ES-8)
CER05
FSW
Monthly Gridded Single Satellite Fluxes and Clouds
CER06
MOA
The meteorological factors include temperature, humidity, pressure, and geopotential height profiles, as well as column precipitable water, Ozone, and aerosols.
CER06
SRBAVG
Monthly TOA and Surface Radiation Budget Averages, Column-Averaged Cloud properties (Source SFC)
CER07
SYN
Synoptic Radiative Fluxes and Clouds—every 3 hours
CER08
AVG
Monthly Regional Radiative Fluxes and Clouds (Source SYN)
CER12
SFC
3.5. LIS Products
LIS data includes orbital lightning products and is available at the NASA Global Hydrology Resource Center (GHRC) (Zhong Liu et al. 2012). The processing is described at different levels as follows (Christian et al., 1992):
3.5.1. LIS Level 1 Processing
The intermediate LIS product at Level 1 will contain a time stamp computation and calibration information appended to the Level 0 data product.
3.5.2. LIS Level 2 Processing
By combining level IA data for individual events at a specific location over an observation period, the level 2 data products are obtained. Algorithms will be implemented to identify neighboring pixels that are illuminated by the same event (i.e., a single optical lightning pulse may illuminate more than one pixel). To identify individual lightning flashes, the optical pulse data will be subjected to further analysis. In terms of optics, a single lightning flash is made up of a series of discrete, short-duration optical pulses that correspond to energetic discharge processes happening inside the cloud. It is important to recognize that not all optical events within a flash will exceed the LIS threshold and register as detections.
In Level 2 data products, you can find detailed geophysical parameters of total pulses and lightning flashes that occurred within a specified observation period. Ongoing research may enable the identification of discharge types for the flashes. Two sets of data are expected to be produced, considering the substantial difference between thunderstorm activities during the day and night.
3.5.3. LIS Level 3 Processing
The level 3 data products involve mapping and time-averaging US geophysical parameters onto a uniform Earth-based grid. The spatial resolution of standard level 3 data products will be within the range of 0.1° to 2.5°. These products will be aggregated to generate lightning maps globally for pentads, monthly, seasonal, yearly, annual, and interannual timeframes. Level 3 data products will encompass maps and statistics for total optical pulses, densities, total flashes, mean, extreme value statistics, radiant intensities, discharge type, and flash duration.
3.6. Combined products
COMB products are combined PR and TMI data products, as shown in Table 9 (TRMM Data Users Handbook, 2001; Zhong Liu et al., 2012).
Table. 9. TRMM combined Products
Description
Level
Combine PR/TMI Rain Profile and path-integrated attenuation.
2B31
Combined PR/TMI Monthly Rainfall. It calculates snow, rainwater, surface and convective rain rate, and graupel at 28 levels. It also calculates monthly accumulated rainfall for the near surface and 14 vertical layers at each 5° x 5° grid.
3B31
the 3-hourly TRMM Multi-Satellite Precipitation Analysis (TMPA) products, 0.25° x 0.25° merged
3B42-3 Hourly
0.25° x 0.25° grids derived from 3B42
3B42- Daily
TRMM and Other Data Sources Monthly Rainfall” provides a “best”
precipitation estimate in the TRMM region from all global data sources,
namely TRMM, SSM/I microwave, geosynchronous IR, and rain gauges. 0.25° x 0.25° grids
3B43
3.6.1. COMB Level 2 Processing
This product is derived from PR data and TMI 10 GHz channel data and includes the correlation-corrected mass-weighted mean drop diameter, coefficient of rain attenuation correction, rain rate, and PIA. For 2B31 processing, the input data is read from TMI 1B11, 2A12, and PR 1C21. The output of 2B31 is used for 3B31.
3.6.2. COMB Level 3 Processing
These products include 3B31, 3B42, and 3B43. The 3B42 and 3B43 products are the most popular multi-satellite precipitation products, known for their high spatial and temporal resolutions. For 3B31 processing, TMI 2A12 and PR 2B31 are input. The 3B31 algorithm is used to produce high-quality rainfall retrievals for the narrow PR band (220 km) in the 2B31 data as well as to calibrate the broad (760 km) TMI rainfall retrievals produced in the TMI 2A1 data. The output of 3B31 is used for 3B42 and 3B43.
The 3B42 is used to provide a rainfall estimate in the TRMM area that has the dense sampling of geosynchronous IR imagery and (nearly zero) bias of the "TRMM Combined Instrument" precipitation estimate. 3B42 uses two algorithms to achieve its objective: one for monthly IR calibration parameters and another for calibrating merged-IR precipitation data.
4. Multi-Satellite Algorithms for TRMM (TMPA)
The Tropical Rainfall Measuring Mission (TRMM) Multi-Satellite Precipitation Analysis (TMPA) (also known as TRMM 3B42) combines multiple satellites and gauge data to provide fine-scale precipitation estimates (Huffman et al. 2007). TMPA utilizes the TRMM satellite to calibrate and merge PMW estimates from different platforms. TMPA fills in the gaps in the PMW field by using geosynchronous IR measurements calibrated against PMW estimates on a monthly basis. TMPA covers up to ±50° latitudes and is available at a resolution of 0.25° every 3 hours (Tan et al. 2017). Two different products of TMPA are available: the real-time product (TMPART with a 6–9 hour delay) and the research product (TMPA-P; two months latency) (Wu et al. 2012). The calibration method of the TMPA research product was modified in October 2014 following the decommissioning of the TRMM satellite. Although there may be a disruption in data from September to October 2014, gauge adjustment can minimize, if not eliminate, any inaccuracies in land estimates (Bolvin and Huffman 2015).
5. The TRMM Precipitation Products
For 17 years, TRMM has provided high-resolution precipitation data. One of the main challenges for the Science Team is validating climatological rainfall products from TRMM (Kummerow et al. 1998). These products are listed in Table 10.
Table. 10. TRMM precipitation Products (Zhong et al. 2012; Kummerow et al. 1998; NASA )
Level
Sensor
Product Name
Spatial Resolution and Coverage
2
PR
2A25
• 5km x 5km
• Single orbit
• 16 orbits/day (35°S-35°N)
TMI
2A12
• 5km x 5km
• Orbital
• 16 orbits/day (38°S-38°N)
Combined TMI & PR
2B31
• 5km x 5km
• Orbital
• 16 orbits/day (38°S-38°N)
Click this link to see the full specification table
Satellites offer the best platform for global precipitation measurements. In 1997, NASA and the National Space Development Agency of Japan (NASDA), now called the Japan Aerospace Exploration Agency (JAXA), launched the Tropical Rainfall Measuring Mission, operating until April 2015. Equipped with a passive microwave multi-frequency imaging radiometer (provided by NASA) and a Ku-band radar channel (provided by NASDA), the TRMM spacecraft could generate three-dimensional precipitation structures. TRMM offers a dataset of 17 years of uninterrupted measurements in the tropics and subtropics, which has been actively used by a large user community for decision-making. TRMM had more than just surface rainfall mapping as a goal; understanding the vertical distribution of latent heating and its implications on insight into seasonal and intraseasonal variability of the tropical circulation was also crucial (TRMM products 2H25 and 2H31).
02/27/2012
Latent heat (CLH)
Launch: 04/02/2015
03/03/2012
8
Launch: 04/08/2015
Winter of 2016 (TBD)
Hourly Gridded Single Satellite TOA and surface Fluxes/clouds
(parametrization method) (consists of surface only data, region data, total sky radiative fluxes at TOA and surface, clear sky radiative fluxes at TOA and surface, angular model scene classes, column-averaged cloud properties)


Comments
No comments yet
Be the first to comment
Share your thoughts and start the conversation.