HAMMER Software Guide Drinking Water Transmission Simulation software training
Share
Evaluating the water HAMMER in pipelines is essential in hydraulic and transport fluids, as it refers to the unpredictable behavior of liquid in pipes. This phenomenon can occur as behavior suddenly and during changes in rapid flow or obstruction in pipelines. Also, this phenomenon can have consequences for the structures, equipment, and safety of fluid transport systems. In the past, evaluating the water HAMMER was theoretical and experimental; also, it needed a more accurate understanding of fluid dynamics methods for preventing the damage, which was increasingly felt. In the 19th and 18th centuries, with the emergence of the mechanic field, more work was done about the water HAMMER. Also, engineers paid attention to the analysis of the hydraulic equations, including Navier-Stokes equations and the Law of Conservation of Energy. These equations helped engineers better understand how changes in flow and pressure affect each other (Wood, 1970). Consequently, with the advancement and development of computers and engineering software, evaluating the water HAMMER through accurate methods. These software include Bentley HAMMER, AFT Impulse, PIPE-FLO, WANDA, and Surge 2000, which engineers were capable of simulating the behavior of the hydraulic systems and the predictive effect of the water HAMMER.
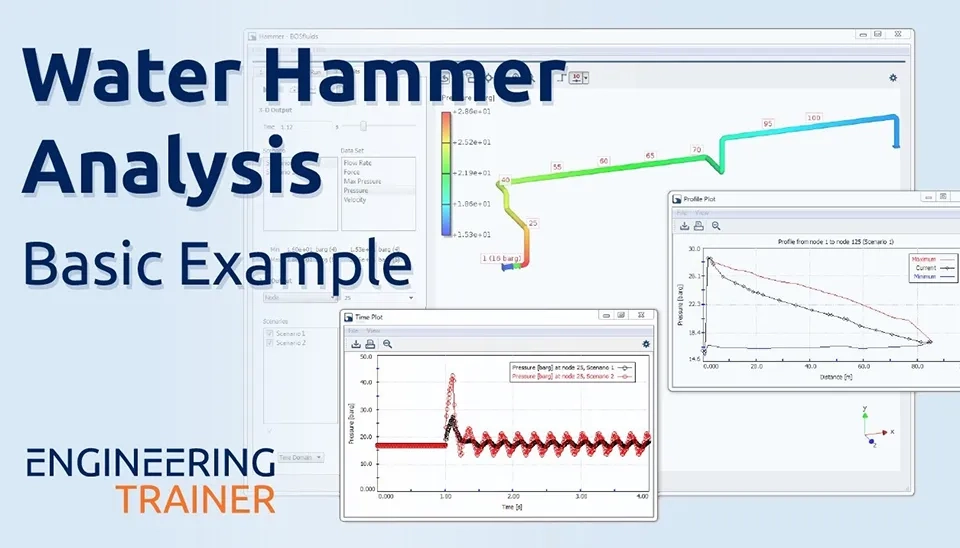
Fig. 1. Hydraulic analysis of water transmission with HAMMER software.
1. Understanding the Causes of Water Hammer in Pipelines
The water HAMMER is a hydraulic phenomenon that occurs in effecting the sudden change in fluid flow in the pipe. This sudden change creates an increase in the suddenly and extremely high pressure in the system that can damage to the pipes, valves, and equipment. The main reason for generating a water HAMMER can be that Rapid Pump Start/Stop, Sudden Valve Closure, High Water Velocity, Abrupt Changes in Pipe Direction or diameter, and Air Entrapment, for example, due to power, can cause a water HAMMER effect.
1.1. Rapid Pump Start/Stop
Sudden starting and stopping of the pump causes a drastic change in flow rate, which can generate water HAMMER. Sudden changes in pump rotation speed can cause extreme pressure and create mechanical stresses in the system. Optimizing the process of starting and stopping the pumps can reduce these fluctuations and prevent damage to the equipment (Zheng et al., 2023).
1.2. Sudden Valve Closure
Closing a valve reduces the speed of fluid in the pipe; also, that Kinetic energy suddenly will transform the pressure. This sudden change generates a wave traveling along the pipe, which can lead to extreme pressure fluctuations and, in some cases, structural damage like burst pipes. A study by (Yuce and Omer, 2019) showed that the timing and method of closing the valve directly affect extreme pressure fluctuations.
1.3. High Water Velocity
High water velocity in the pipe can cause increased erosion, cavitation, and water HAMMER, which damage the pipe’s structure. To decrease this effect, it is necessary to consider the proper diameter, velocity, and pipe material when designing hydraulic systems. Also, using protective equipment such as surge tanks is essential to prevent water HAMMER (Choon et al., 2012).
1.4. Abrupt Changes in Pipe Direction or Diameter
Abrupt changes in pipe direction or diameter can cause the flow to suddenly stop or change direction. As a result, extreme pressure is created in the pipe. The pressure can damage the pipe and equipment, which causes the serious brokenness in the pipeline. A suitable design is suggested for using protective equipment like surge tanks and a surge relief valve to prevent this problem (Tan et al., 2012). Also, the pressure of water HAMMER significantly decreases in pipe materials with a lower elastic modulus and larger diameter for the same operating condition. This is because pipes are able to absorb and dissipate the sudden pressure caused by the flow velocity changes (Ahmed et al., 2024).
1.5. Air Entrapment
Air trapping in pipes can decrease the severity of water HAMMER or create extreme pressure fluctuations. Air acts as a compressible cushion, but in case of a sudden release, a localized increase in pressure surge may occur. The proper air discharging, the suitable slope design, and gradual valve operation are necessary (Zhang et al., 2018).
2. Key Features of Bentley HAMMER Software for Hydraulic Analysis
Bentley developed Water HAMMER, which you can download from the main Bentley website. Registration on the Bentley website is required to download the software. The pipeline system uses this software for its analysis and simulation of the water HAMMER phenomenon. The first time water HAMMER was defined was in the 1990s; also, it has been continuously updated since then. Currently, the newer and more advanced versions of it are available for more complex analysis.
In the early stages of studying the water HAMMER phenomenon, significant focus was placed on the behavior of column separation, which can occur when the pressure within a pipeline rapidly decreases, causing a vacuum effect and subsequent cavitation. According to a historical review, the phenomenon of water HAMMER and its associated effects have been studied since the 1940s, with numerous advances in both experimental techniques and numerical simulations developed over the decades to better understand the dynamics of these pressure surges and the potential for damage in pipeline systems. These advancements have led to better predictions and more effective control measures for water HAMMER events, particularly in complex fluid systems (Bergan et al., 2006).
Water HAMMER refers to suddenly increasing pressure in pipeline systems, which is generated due to suddenly stopping the flow or rapidly changing the velocity in pipelines. This phenomenon can create damage to the pipe and equipment, and as a result, it causes financial losses and safety risks. HAMMER software was introduced by the Bentley company in 1984. This software has helped the designers and engineers that simulate and analyze the water HAMMER.
Fig. 2. Hydraulic analysis with HAMMER software for pipelines.
2.1. Key Features of HAMMER Software
TheWater HAMMER is a powerful software tool designed for the analysis and management of data, particularly useful in the piping industry. This software enables users to efficiently analyze and summarize data and, finally, achieve valuable results (Tang et al., 2024). In addition, Water HAMMER allows some tools for reporting and analyzing data, which helps users understand the results and share them with others. Below are the most important specifications of HAMMER Software:
Hydraulic Systems Simulation
The main advantage of the Water HAMMER is modeling and analyzing systems of the transport of water and sewage with high quality, also supporting the simulating of transient flow and the effects of the Water HAMMER.
Analyzing The Water HAMMER
One of the main advantages of the Water Hammer is that it can predict and manage the effects of the suddenly changing pressure in the pipeline and provide solutions for decreasing its dangers.
Supporting From Types of The Pipes and Valves
In addition, this software can model various types of pipes, pumps, valves, and reservoirs. Also, it can define hydraulic and physical parameters.
Analyzing the Operational Different Situations
The other advantages of this software include simulating various operational situations and monitoring sudden flow changes, as well as analysing the effects of abrupt turns on the pumps and their impact on flow changes.
Capability to Connect with AutoCAD and ArcGIS Software
Also, this software can exchange the data with AutoCAD and ArcGIS software; additionally, it has compatibility with other simulation modeling such as WaterGEMS, WaterCAD, and Epanet.
3. Analyzing Water Transmission with HAMMER Software: Step-by-Step
Before using Water HAMMER software to review the unsteady flow conditions in the pipeline, it is also essential to perform some basic calculations. This calculation helps to better understand the system’s behaviour and adjust the correct input in the software. Following this, the most important calculations that must be performed before analyzing with Water HAMMER software are given below:
3.1. Calculation Steady Flow Conditions with WaterGEMS
Modeling system piping used by WaterGEMS to analyze the steady flow includes reviewing distribution pressure and flow in the network and ensuring performance of current main components such as pumps, valves, and tanks. In this process, energy loss along the pipe is calculated using the Darcy-Weisbach or Hazen-Williams; also, it is evaluated to affect pipe roughness and hydraulic conditions, which ensure the flow is located within the appropriate design property and from the occurrence of adverse conditions such as excessive turbulent flow, cavitation, and water HAMMER (Awe et al., 2019 and Paluszczyszyn et al., 2015).
3.2. Determining The Characteristics of Pipes and Fluid
Before modeling and analyzing the Water Distribution Network in WaterGEMS, one must determine the pipe and fluid physical features. These parameters directly affect the behavior of the system hydraulics (Garcia-Hernandez et al., 2010).
3.3. The Wave Speed in Pipeline System
The wave speed (a) is a crucial parameter in transient flow analysis, particularly in water HAMMER studies. This wave indicates the velocity at which pressure distribution in the pipeline system (Ming et al., 2017).
The wave speed is calculated following Eq. 1:
a=ctD KE+1 Eq. 1 Where:
a = pressure wave speed in the i-th pipe (ft/s),
c = Speed of sound in water,
K = Bulk modulus of elasticity water (lb/ft²),
E = modulus of elasticity of the pipe material (psi),
t = Pipe wall thickness (ft),
D = Internal diameter of the pipe (ft)
3.4. Critical Valve Closure Time
The critical valve closing time is a key parameter in water hammer analysis, which has a direct impact on the severity of pressure surges in the piping system. If a valve is closed too quickly, it can cause strong pressure surges, resulting in damage to pipes and equipment. On the other hand, closing the valve slowly can prevent this phenomenon from occurring (Toumi and Sekiou, 2017; Han et al., 2024).
This time represents how long it takes for the wave speed, after being generated, to travel from the point of valve closure to the end of the pipe and back (Davies et al., 2022). This duration can be calculated using the following equation two:
T= 2 Lc Eq. 2 Where:
T = The time taken for the wave speed to travel to the end of the pipe and back.
L = The length of the pipe
c = The wave speed
Therefore, to analyze the flow in unsteady conditions, use the Water HAMMER software. At the beginning of the pipeline, we generate the steady flow condition by suddenly turning off the pump. Consequently, to control the water HAMMER due to this phenomenon, the different scenarios executed include a surge tank, air chamber, surge vessel, check valve, and surge relief valve (Li et al., 2024). Therefore, this education will focus on the design of the water distribution related to Henrietta to check the Water HAMMER model. So, engineers can access the water distribution network related to Henrietta from the following link.
Fig. 3. Effective simulation of water transmission in HAMMER.
4. Water Transmission Line Modeling in HAMMER: Best Practices
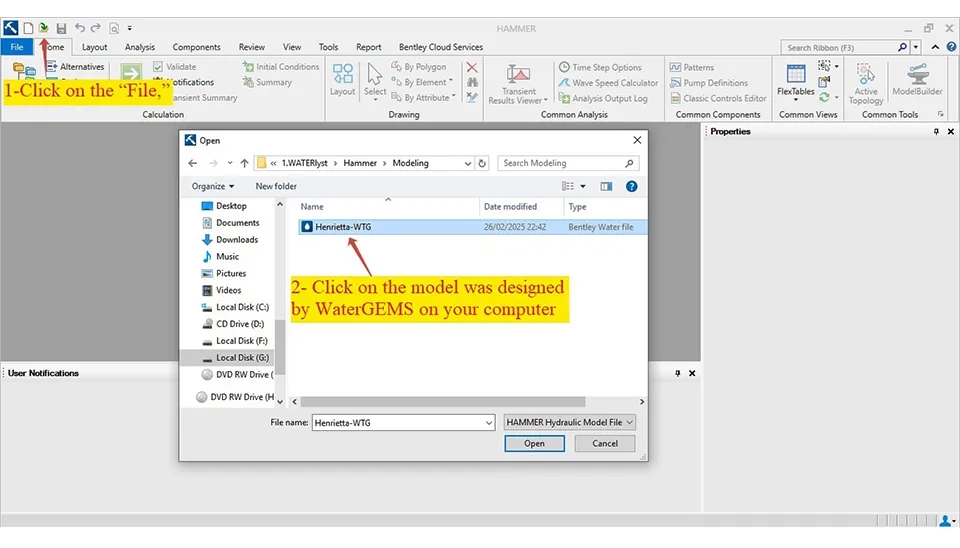
In the beginning, the model was created in WaterGEMS software. It needs to be opened with the HAMMER software. To do this, click on the "File," then click on the "Open" option, and next click on the "Browse" to locate and select the model that was saved by WaterGEMS software on your computer. When the model is opened in HAMMER, save it in the software's format (Fig. 4).
Fig. 4. Opening and saving a WaterGEMS model in HAMMER.
4.1. Importing The Wave Speed in Water HAMMER Software
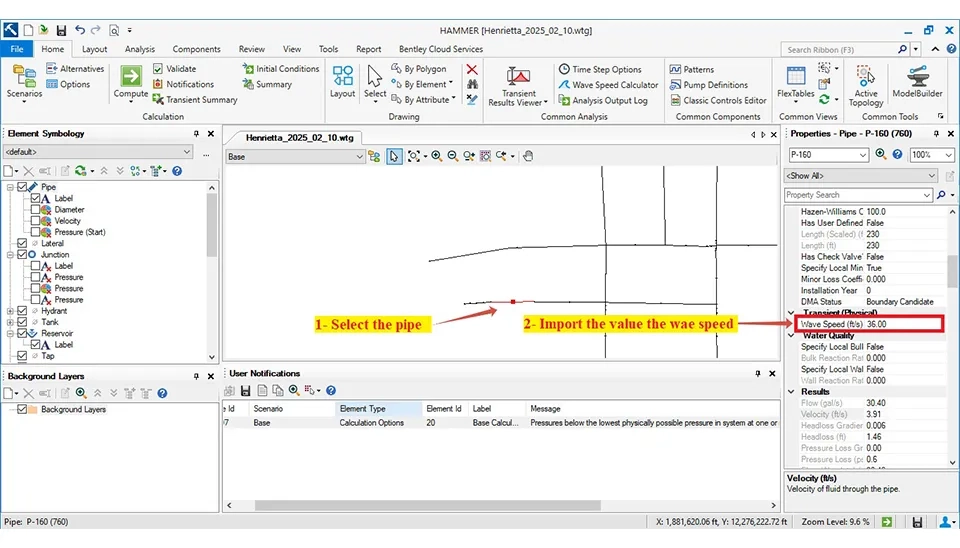
There are two methods to import the wave speed in the Water HAMMER software. Firstly, the software can import the manually calculated wave speed. In this way, select each pipe of the desired, then open the ‘Properties box" and import the value of the wave speed (Fig. 5).
Fig. 5. Importing the wave speed for each pipe in HAMMER.
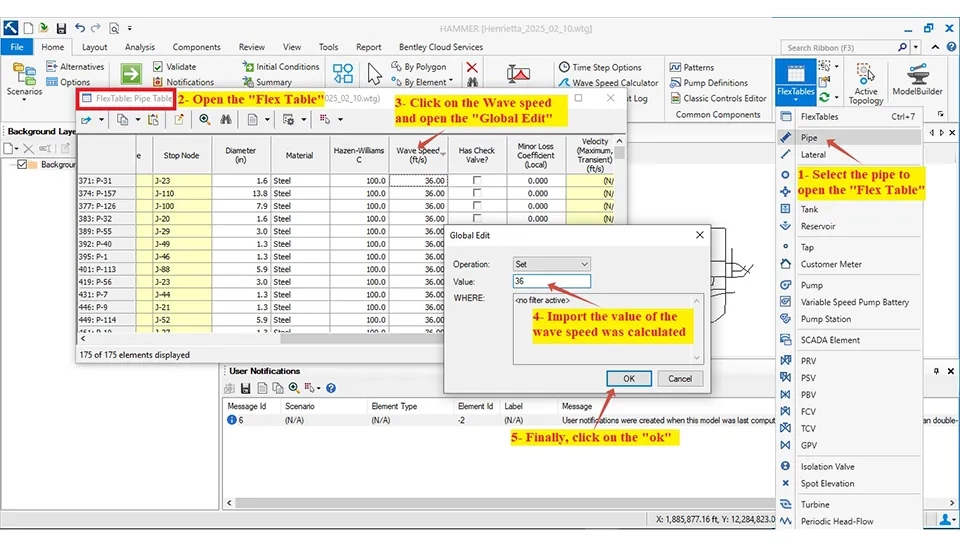
Also, it can import the wave speed at the same time for all pipes in a way that in the "Flex Table," you click on the wave speed and open the "Global Edit"; finally, it can import the value of the wave speed for all pipes (Fig. 6).
Fig. 6. Batch editing wave speed values in HAMMER FlexTables.
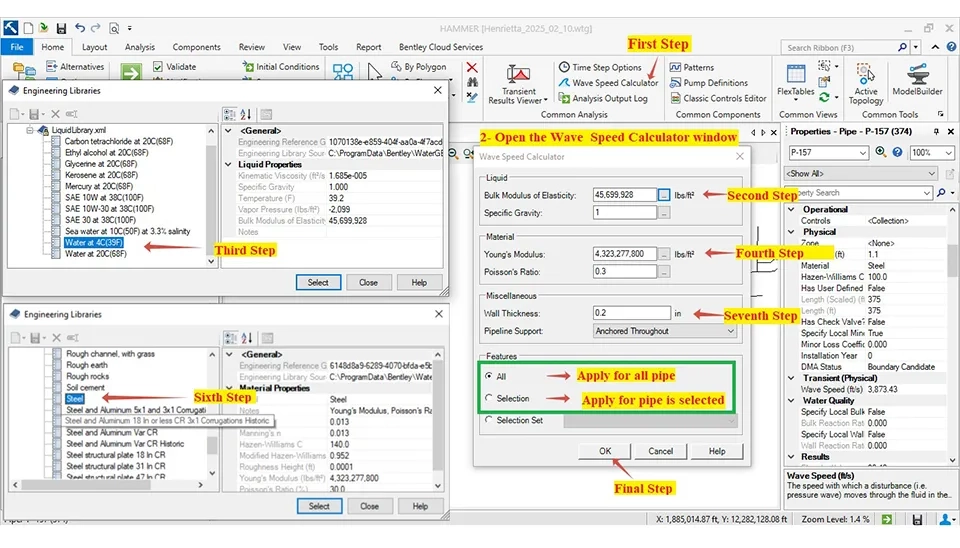
Another method to calculate the wave speed is by using the Water HAMMER software. In this way, first, click on the "Wave Speed Calculator" in the "Home" part. After that, open the window of the Wave Speed Calculator." The Wave Speed Calculator requires importing the bulk modulus of elasticity for liquids, Young's modulus for materials, and Poisson's ratio values. These are imported using the Water HAMMER software. You can choose the bulk modulus of the liquid and the Young's modulus of the material from the software's library. You need to select "Water 4C (29F)" in the library for the bulk modulus value of liquid elasticity. Additionally, you must choose a material type in "Library Material" to determine both Young's modulus and Poisson's ratio values. The wave speed was calculated at 3873 ft/s (1180 m/s) for pipe 14 in (400 mm) steel with 0.24 inch wall thickness by the Water HAMMER software (Fig. 7).
Fig. 7. Hydraulic analysis with HAMMER software wave calculator.
4.2. Simulating Shut Pump Down in The Water HAMMER Software
When a pump suddenly shuts down due to going out of power, the speed of the fluid decreases, and the negative pressure and the pressure unexpectedly increase in the pipeline, which can hurt the equipment. Therefore, simulation can mitigate these issues:
Calculating the sudden pressure in the pipeline and equipment
identifying the critical area that may be damaged.
This article will simulate the water HAMMER phenomenon. Therefore, simulating pump shutdown in the Water HAMMER software helps identify and predict negative pressure, optimize design, increase safety, and reduce equipment repair costs.
4.3. Simulation and Analysis of Sudden Pump Shutdown
We simulate and analyze the water HAMMER phenomenon using two methods of sudden pump shutdown. First, it involves the sudden shutdown of the pump for a specific period of operation. In this condition, the sudden change of the flow speed can create high pressure within the flow. This pressure fluctuation can damage the pipes and equipment. This is especially true if the equipment is situated in close proximity to the pump. This method involves such a setting in the WateR HAMMER software for simulating. These settings include:
First, the calculation of the run duration (sec) requires choosing the specific flow path. Then, the time is calculated for this desired pipe:
L = 16,200 ft (411.5 m)
A = 3,802.12 ft/s (1,230.42 m/s)
t=2La ⇒ 2*162003802.12 ⇒ t = 8.5 seconds
The way to select the pipe desired is to follow these steps:
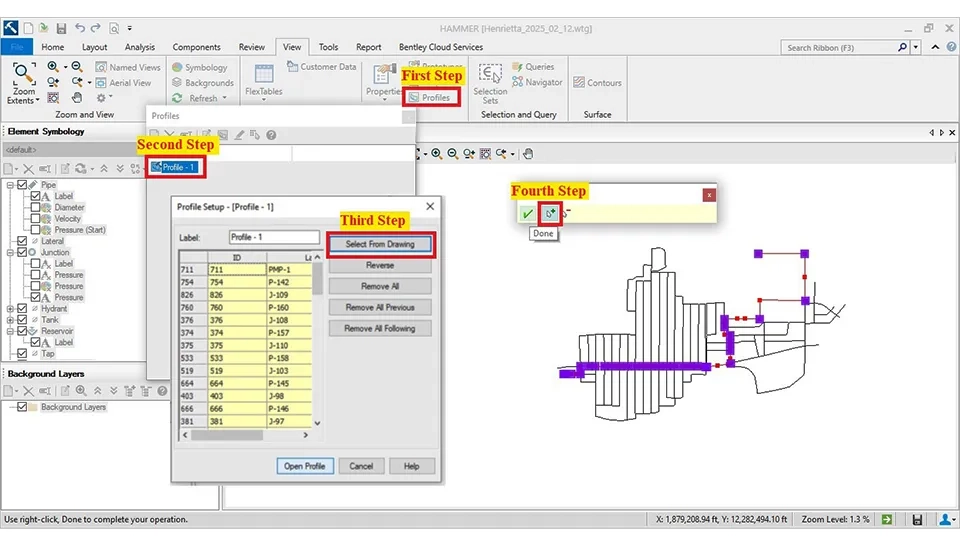
First step, it must select the "Profile" in the "View" tab in the Water HAMMER software. Next step, it needs to create a new profile in the "Profile" box. Then, select the pipe desired in the software (Figs. 8 and 9).
Fig. 8. Analyzing water transmission with HAMMER software.
Fig. 8. How to create New Profile in The Water HAMMER Software
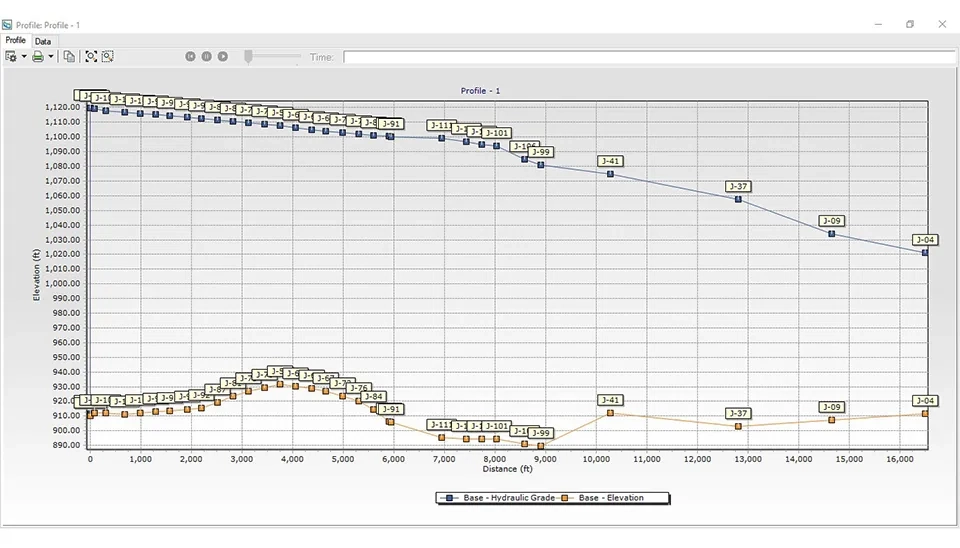
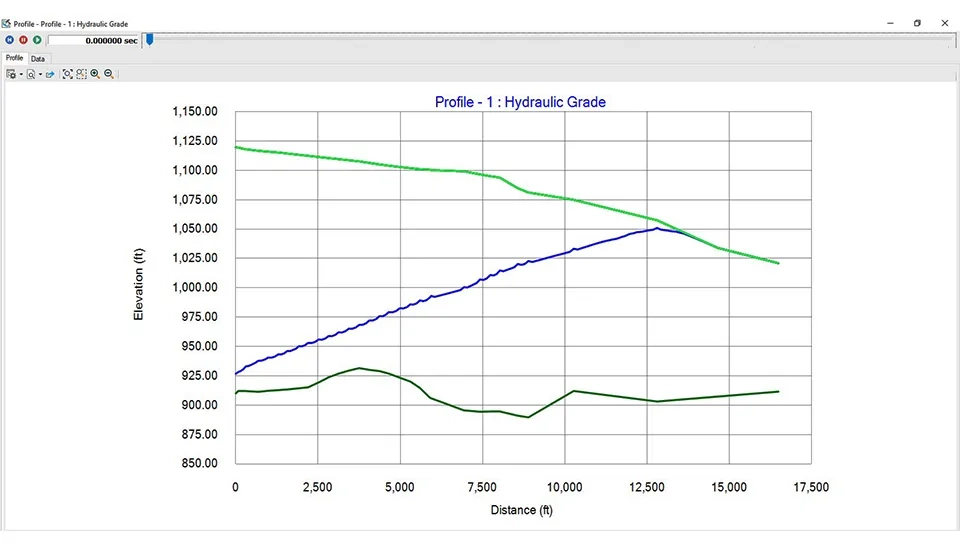
After selecting the desired pipe, the profile related to the "hydraulic grade" and ‘elevation’ of the pipe can be displayed using the method shown in Fig. 9.
This diagram shows the hydraulic and topographic profile of a water system, which is usually used in the analysis of pipeline networks and water transmission pipes. In addition, the horizontal axis represents distance (ft), while the vertical axis indicates elevation (ft). The blue line illustrates the Hydraulic Grade Line (HGL), while the yellow line represents the topography. A decrease in the slope of the hydraulic line significantly causes a pressure drop along the path. So, this type of diagram is typically used to assess the adequacy of hydraulic design, pressure losses within the system, the potential occurrence of cavitation, and the optimization of piping routes.
Fig. 9. Optimized water transmission lines: HGL vs Topography.
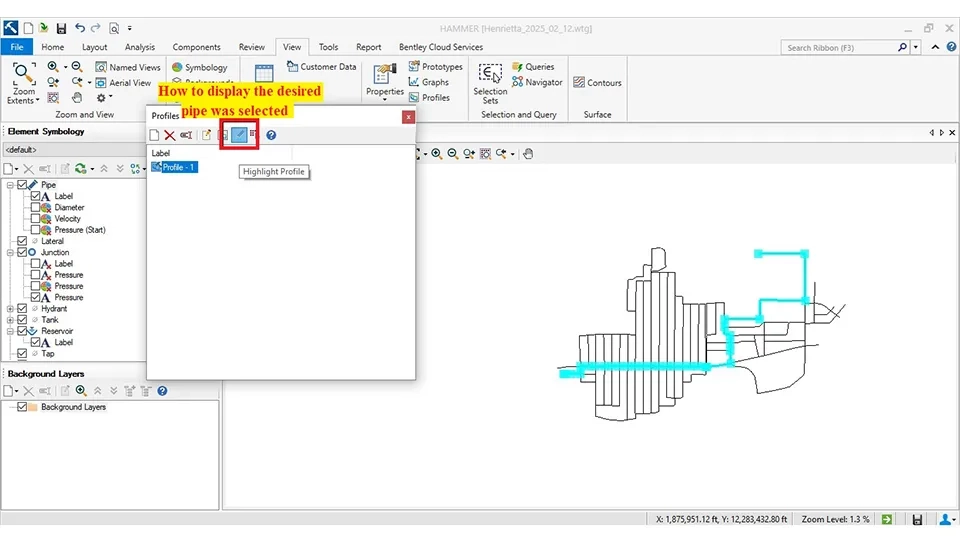
Finally, the desired pipe was selected in the software using the method shown in Fig. 10. Next, the water hammer analysis will be conducted to identify where it occurs in the selected pipe.
Fig. 10. Final pipe selection for water hammer simulation.
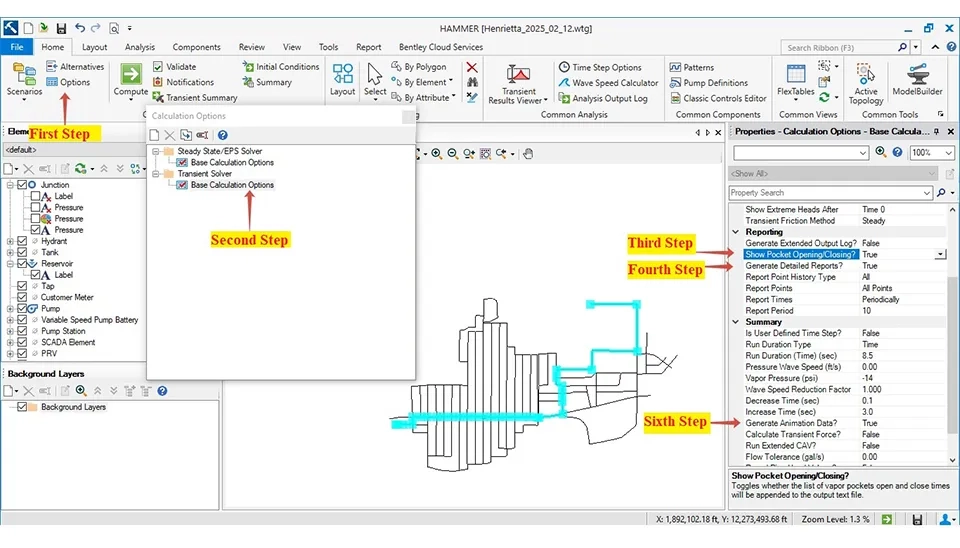
Then, it must set some initial settings about "Calculation Option" as shown in Figure 9. First, select the "Option" under the Home tab. Then, open the "Calculation Option," and double-click on the "Base Calculation Option," which will open the "Properties-Calculation Option-Base Calculation Option" window. Finally, adjust the settings related to the pump in this window (Fig. 11).
Fig. 11. Adjusting transient calculation options in HAMMER.
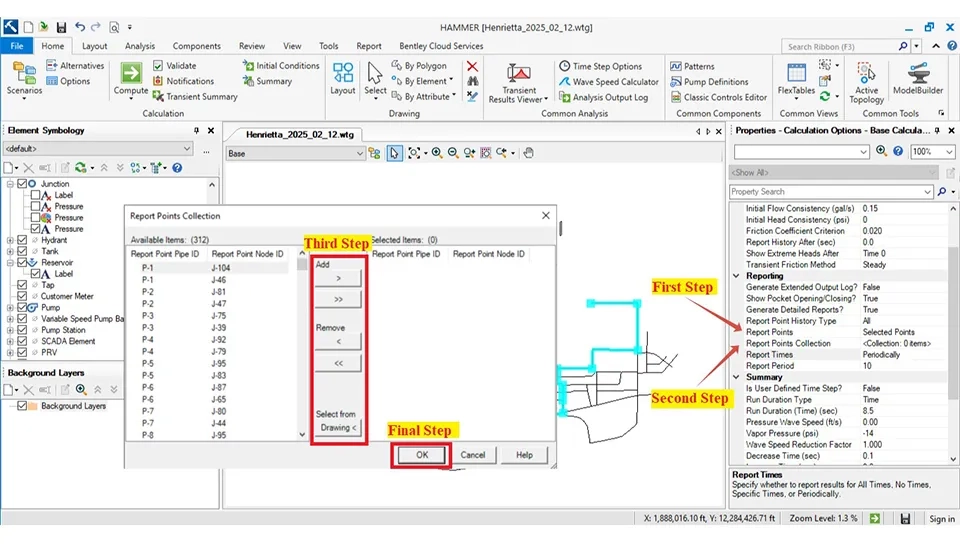
In continuation, in addition to selecting the critical pipes and nodes through the "Profile." Also, it can choose the critical pipes. First, in the "Report Points," choose the "Selected Point" in the drop-down menu in the "Properties-Calculation Option-Base Calculation Option" window. Then, it can select the critical pipes and nodes in the "Report Pipes Collection." After clicking on it, open a window in which it can "Add," "Remove," and "Select from Drawing" in the software. Finally, it must select "Ok" to finish these steps (Fig. 12).
Note: It is not necessary to select the pipe before the pump because the pressure generated by the pump creates the critical condition needed to analyze a water HAMMER using the Water HAMMER software.
Fig. 12. Training on HAMMER for water transmission analysis.
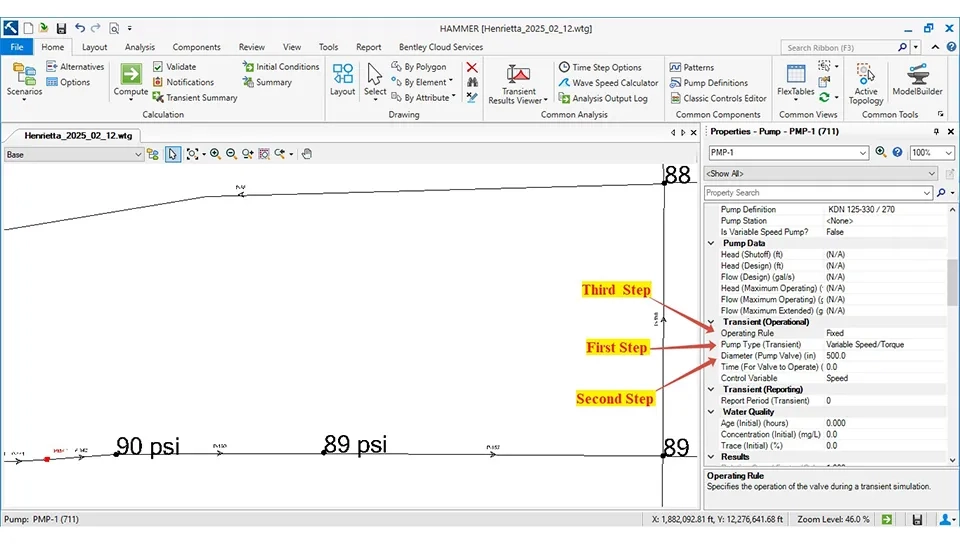
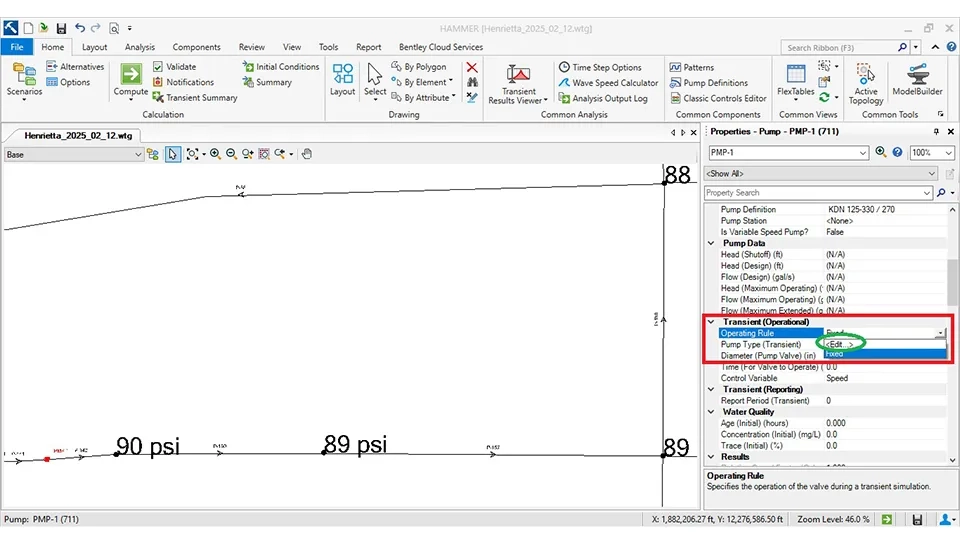
The last step in this method is the settings for the pump in the "Transient Operational." The first step in this method is double-clicking on the pump to open its "Properties." After that, the "Variable Speed/Torque" is opted in the "Pump Type (Transient)" in the drop-down menu. Then, enter the diameter of the pump’s outlet pipe in the "Diameter (Pump Value)" field. Set the parameters for the pumps' stopping time after that (Fig. 13).
Fig. 13. Training on HAMMER for water transmission analysis steps.
To import the setting for the pump related to the "Operating Role" first, select "Edit" from its drop-down menu (Fig. 14).
Fig. 14. Accessing the pump operating rule editor in HAMMER.
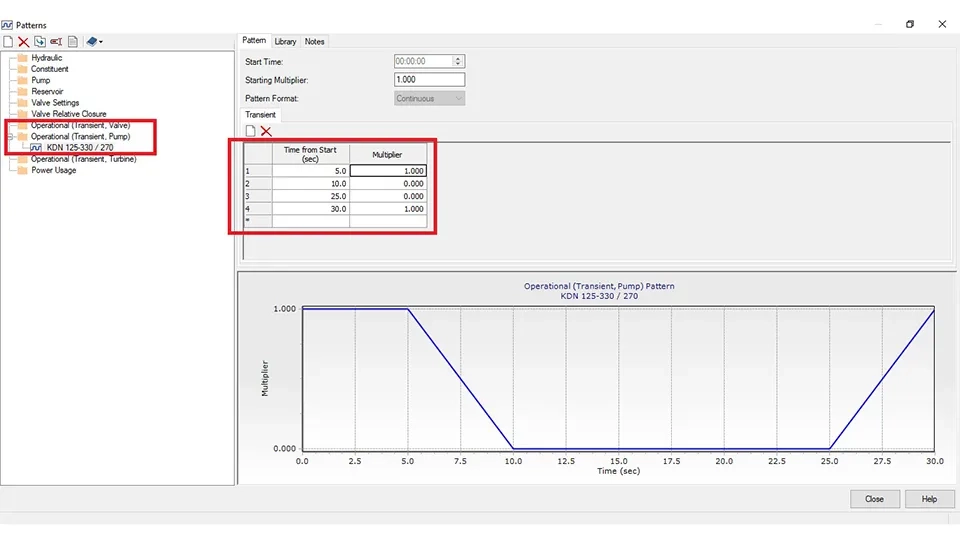
Then, a new window named "Patterns" will open, where the information for shutting down the pumps is imported for simulation. In addition, the "Operational (Transient Pump)" option is used for the pump’s settings.
Next, enter the shutdown time for the pump. Right-click on "Operational (Transient Pump)" and select "New." Then, choose a name for the pump. In the adjacent table, following the example shown in Figure 15, enter the desired timing for closing and shutting down the pump. Finally, click on "Close."
Fig. 15. Defining operational patterns for pump shutdown simulation.
This diagram represents the performance pattern of a pump under transient conditions that shows the changes in the pump’s coefficient of performance over time. Initially, the pump operates with a coefficient of performance of 1. After 5 seconds, the performance coefficient suddenly drops to zero after 10 seconds, indicating a complete stop of the pump. This condition is maintained until 25 seconds, after which the pump gradually restarts and returns to its initial state (coefficient of performance of 1) by 30 seconds.
Note: In the table, select 1 to start the pump and choose zero to shut down the pump.
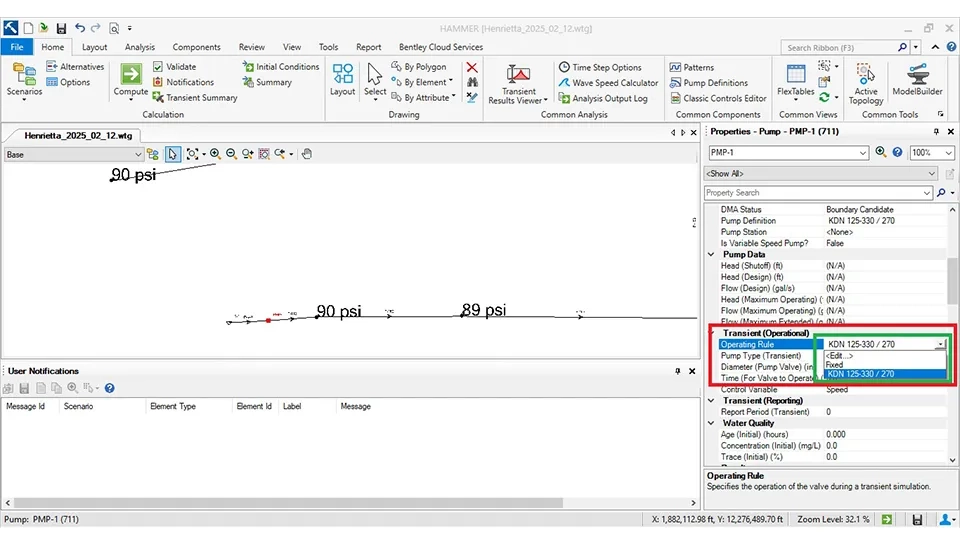
After importing information related to shutting down and starting the pump, select the pump in the "Operating Rule" in the drop-down menu under "Transient Operational" when the pump is selected (Fig. 16).
Fig. 16. Linking the transient operating rule to the pump in HAMMER.
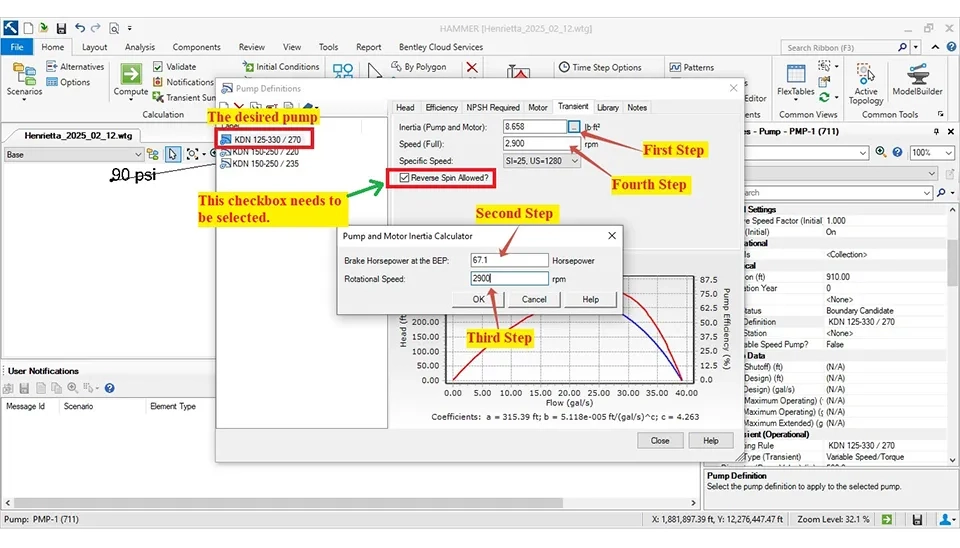
The last step must enter the essential information related to the pump, such as the "Flow," "Head," "Efficiency," and the information of the "Transient." WaterGEMS and Water HAMMER software import data like "Flow," "Head," and "Efficiency" similarly. However, the "Transient" settings also need to be configured in the Water HAMMER software. The "Transient" has two sections for entering information: the "Initial (Pump and Motor)" and "Speed (Full)." Also, the "Brake Horsepower at the BEP" and the "Rotational" are essential for calculating the "Initial (Pump and Motor)" (Fig. 17).
Note: The checkbox for "Reverse Spin Allowed" needs to be selected.
Fig. 17. Entering performance and transient data for pump simulation.
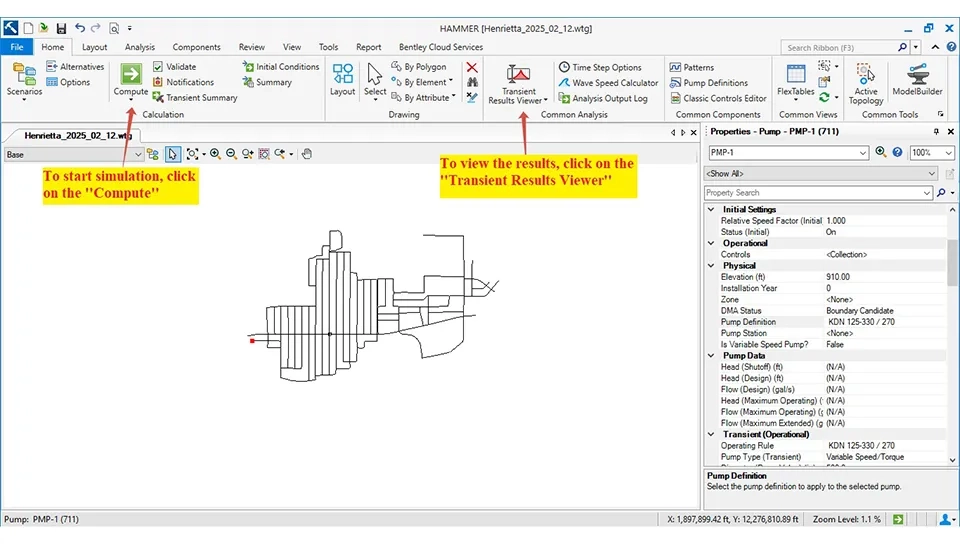
Finally, click on "Compute" to simulate a water HAMMER in the Water HAMMER software. To view the results, you can also choose the "Transient Results Viewer" option (Fig. 18).
Fig. 18. Executing the transient simulation and viewing results.
4.4. How to Interpret The Results in The Water HAMMER Software
The "Transient Results Viewer" can display various results, including:
Energy Grade Line (EGL)
Hydraulic Grade Line (HGL)
Air/Vapor Volume
Flow Velocity
In Fig. 19, the results related to the water HAMMER are displayed.
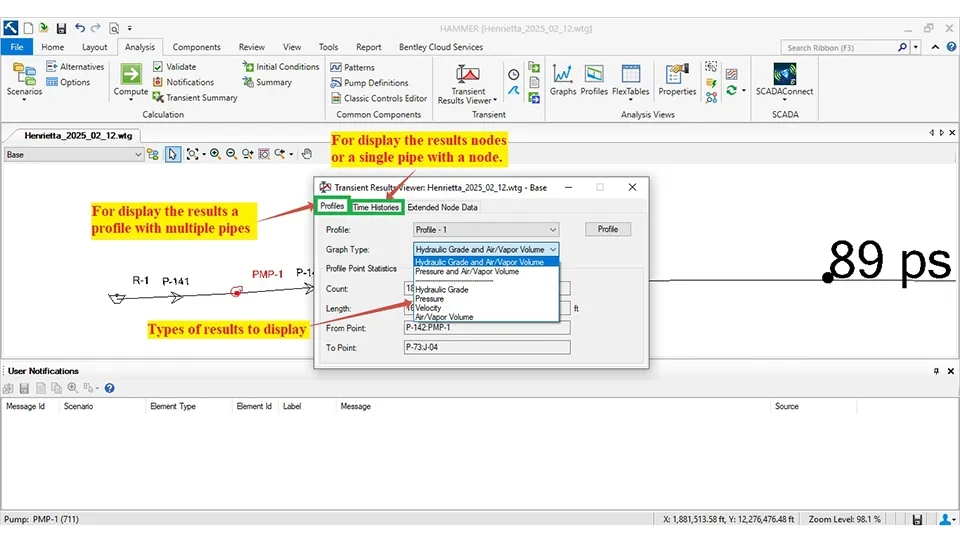
This method is Clicking on the "Transient Results Viewer" opens the "Transient Results Viewer" window, which includes components to display the results: a profile with multiple pipes and nodes or a single pipe with a node.
Fig. 19. Utilizing the Transient Results Viewer for data analysis.
In addition, it can identify the critical area related to:
the negative pressure
Cavitation
water HAMMER
This is achieved by comparing the graphs of "Energy Grade Line (EGL)", "Hydraulic Grade Line (HGL)," and "Ground Profile."
For example:
– If the "Hydraulic Grade Line (HGL)" drops below the "Ground Profile," it indicates a risk of "negative pressure" and "cavitation."
– Large fluctuations between the "Energy Grade Line (EGL)" and the "Hydraulic Grade Line (HGL)" may signify the water HAMMER effect.
Figs. 20 and 21 display the results before and after the simulation about "Pressure and Air/Vapor Volume. Also, Figs. 22 and 23 display the results before and after the simulation about "Hydraulic Grade."
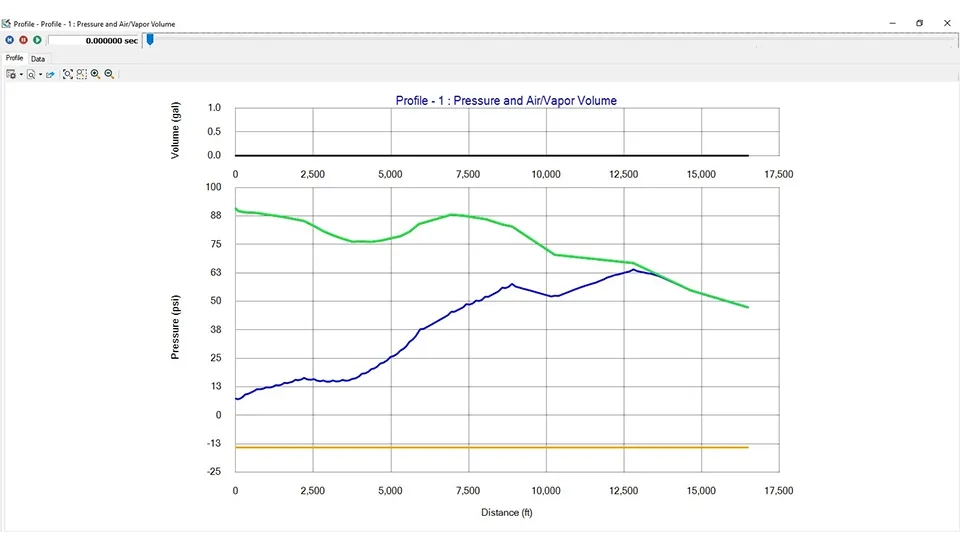
In Fig. 20 (in the initial time), the blue line illustrates the pressure in the pipe is relatively steady and located in the positive range; this shows the system is stable and no cavitation with negative pressure is occurring in the pipeline. Also, the black line shows the air/vapor volume is near zero, which indicates the lack of air or vapor bubbles in the pipeline. This situation indicates the stable initial conditions without the occurrence of a sudden pressure wave at the initial time (Fig. 20).
Fig. 20. Analyzing water transmission with HAMMER software results.
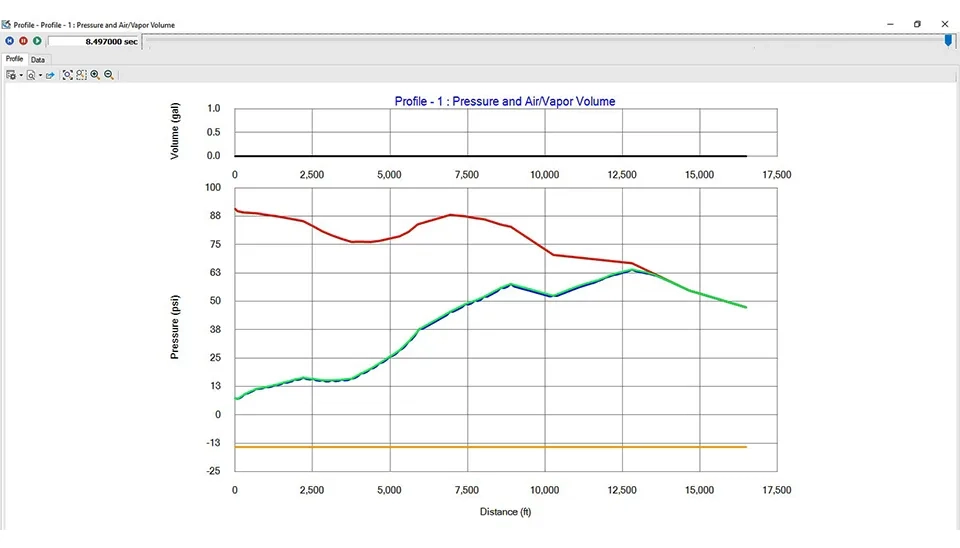
In Fig. 18 (after the passage, the time and occurrence of a water HAMMER), the blue line displays the pressure variations clearly visible along the pipeline; the pressure suddenly decreasing in some points is dedicated to the vacation or pressure drop due to the negative wave caused by the water HAMMER. Additionally, the pressure peaks and troughs indicate fluctuations caused by the pressure wave in the pipeline. Also, the black line illustrates a slight change in the air or vapor volume, indicating the vapor voids are either absent or minimal. In addition, the condition suggests that the pressure wave is reflecting along the pipeline, causing the periodic pressure fluctuations after the passage, the time and the occurrence of a water HAMMER (fig. 21).
Fig. 21. Transient pressure variations and air volume after simulation.
Figs. 22 and 23 present the pressure and volume analysis of the air/vapor in the pipeline. Also, the results are described below:
In fig. 21, at the initial time, the hydraulic profile of the pipeline shows which hydraulic head gradually increases along the pipeline; also, in some areas, this head arrives near the ground elevation. This situation can show the vulnerable spots for creating the vacuums or vapor cavities. The condition is stable because the cavitation has not occurred. However, in cases of sudden changes like shutting down the pump, it is expected that the fluctuation will create extreme changes in pressure and head that may lead to the generation of pressure waves or cavitation phenomena.
Fig. 22. Initial hydraulic grade profile showing baseline head elevation.
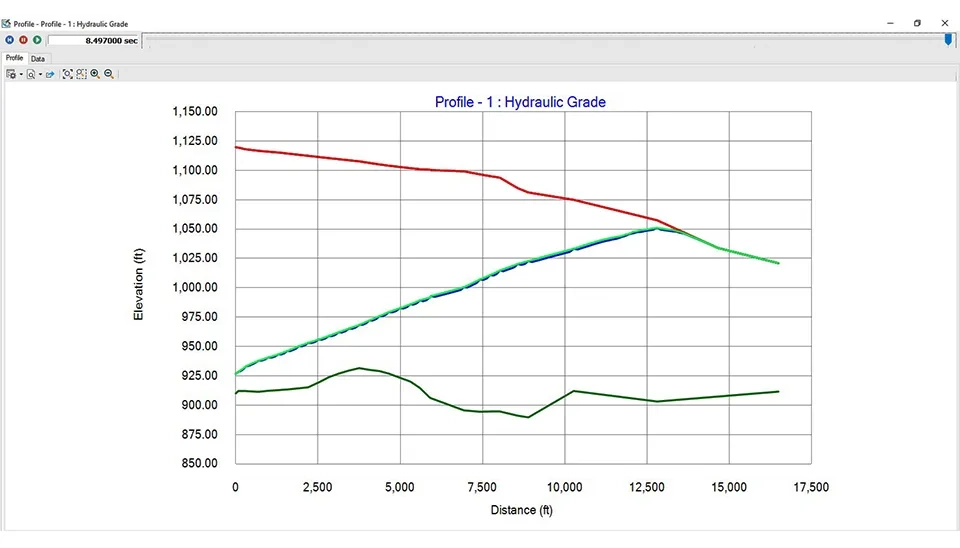
In Fig. 22, after the passage of time and occurrence of a water HAMMER, the changes in the hydraulic head along the pipeline indicate the formation of pressure waves due to cavitation after simulation at 8.5 seconds. A comparison with the initial time shows that the pressure fluctuations have caused increases and decreases in the hydraulic head. In some areas, the head approaches the ground elevation and makes cavitation possible. On the other hand, the recorded head (Red Line) highlights the points with the highest pressure, which may damage the pipeline. These results emphasize the importance of using safety equipment such as air valves and pressure relief valves to reduce the effects of cavitation.
Fig. 23. Post-simulation hydraulic head profile showing surge extremes.
5. Conclusion
The observed fluctuations are due to the reflection of the pressure wave at the end and points of diameter or elevation change in the pipeline. The pressure drop points are indicative of the potential of creating cavitation, which can be damaging to the pipeline. In case the pressure drop falls below the vapor pressure of the fluid, the vapor cavities (cavitation) may occur. Additionally, using control equipment such as surge tanks and air valves can prevent this phenomenon. However, the area where the hydraulic head approaches ground elevation is most susceptible to forming vacuums or vapor cavities, which can lead to cavitation. Events such as shutting down the pump cause fluctuations in pressure and hydraulic head that can be caused by water HAMMER and cavitation. Also, the occurrence of a water HAMMER results in pressure waves that can increase and decrease the hydraulic head along the pipeline. Therefore, the results highlight the need for safety equipment such as air valves and pressure relief valves to minimize the impact of cavitation and protect the system from damage.


Comments
No comments yet
Be the first to comment
Share your thoughts and start the conversation.