
Water is an inevitable, vital need for the survival of all living creatures. Water scarcity affects one-third of the world's population.
Water is an inevitable, vital need for the survival of all living creatures. Water scarcity affects one-third of the world's population. Integrated water management aims to promote water supply from conventional resources as well as wastewater reuse to tackle water scarcity issues (Elhegazy et al., 2020).
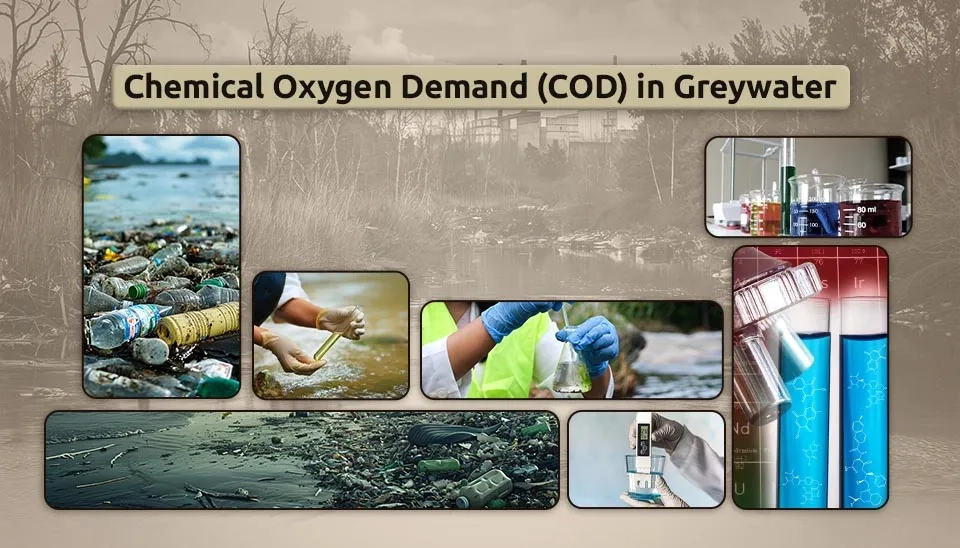
Domestic wastewater or sewage produced by households can be classified into two kinds: blackwater and greywater. Blackwater is that share of domestic sewage that originates from toilets and kitchens and has high concentrations of organic solids. Greywater is water that has already been used domestically without fecal contaminants. This category consists of the leftover, untreated water generated from bathtubs, washing machines, and bathroom sinks (Al-Husseini et al., 2021).
Table. 1. Greywater characteristics, challenges and treatment methods
Parameter | Range |
Chemical Oxygen Demand (COD) (mg/L) | 254–618 |
Biological Oxygen Demand (BOD) (mg/L) | 5–431 |
pH | 6.4–8.1 |
Pathogens (TC) (CFU/100ml) | 3x10³–2.4x10 |
Fats, oil, and Grease (mg/L) | 50–100 |
Electrical Conductivity (µS/cm) | 4–3000 |
Solids (mg/L) | 15–990 |
Temperature (°C) | 18–38 |
Turbidity (NTU) | 14–296 |
Sodium (mg/L) | 120–199 |
Click here to view the complete table, which includes greywater characteristics, challenges, and treatment techniques:
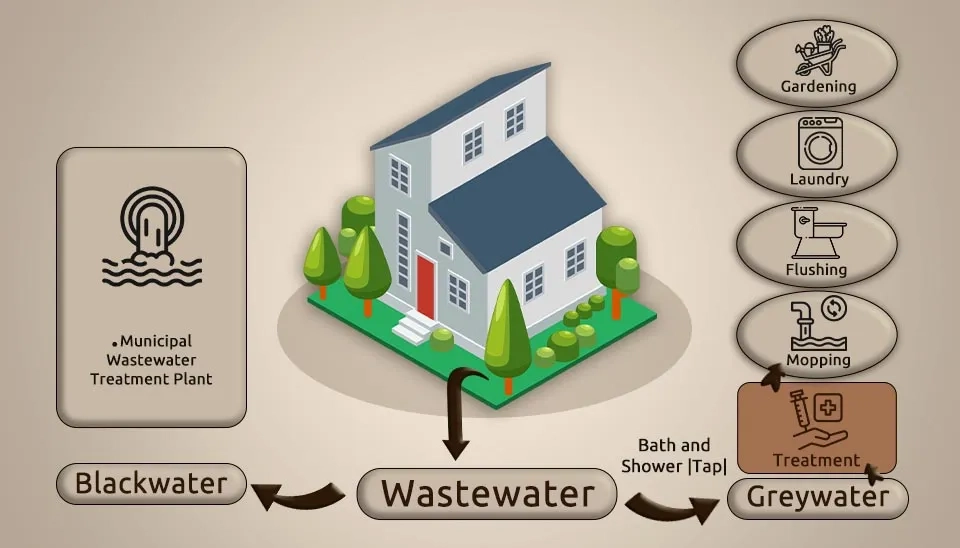
Greywater is generally divided into two types: light greywater, which is generated from bathrooms, showers, tubs, hand basins, and sometimes laundry; dark greywater, which includes laundry facilities, dishwashers, and in some studies, kitchen sinks. Light greywater has a high prospect of being locally treated due to its low contaminant concentrations (Khalil et al., 2020).
Greywater can be utilized for domestic cleaning, washing vehicles, flushing toilets,
washing kitchen gardens, and clothes washing. Greywater is an infinite resource generated throughout the lives of people. Consequently, if greywater is used globally, greywater treatment and reuse have significant theoretical potential to enhance overall available water resources. Locally processed greywater lessens the demands on the water distribution system, reduces building effort and cost, and minimizes the carbon footprint associated with these processes. Such local greywater treatment and reuse offer crucial practical possibilities to magnify total water resources locally. In countries struggling with water stress, the concept of greywater treatment and reuse continuously becomes one of the key strategies. Greywater treatment and reuse are prospective methods of reducing the consumption of potable water in buildings, consequently reducing wastewater released into public sewage and treatment facilities. This strategy has remarkable economic and environmental advantages (Elhegazy et al., 2020).
The prospective advantages of greywater treatment and reuse are vast, ranging from direct benefits to the user to large-scale positive effects for the entire water sector. The most prominent advantage to greywater users can be found in areas where the availability of water is low and water tariffs are high. In such cases, greywater reuse makes it possible to sustain home gardens/agriculture all year long, even in drought, while mitigating water costs (Cook, 2016). Moreover, greywater may benefit the irrigated soil and plants from the nutrients and organic matter (Siggins et al., 2016).
Since high water tariffs are not only a consequence of water scarcity but can also result from high investments in water management, financial advantages may benefit users even in water-abundant regions. Moreover, where environmental awareness is relatively high, the water-saving potential can be considered a contribution to the common good. Widespread utilization of greywater reuse systems could make a significant contribution to the water sector. It has been estimated that urban reuse of greywater for toilet flushing alone could reduce a building's water consumption by 30%. According to research, estimations suggest that about 30% penetration of greywater reuse in multi-story buildings in Israel could result in an annual decrease of 150 MCM of freshwater use. The environmental effects of one desalination plant, including land use, electricity demand, brine treatment, long-distance water transportation, and greenhouse gas emissions, are equivalent to this amount. Another suggested approach to maximizing the prospective value of treated greywater in urban areas is combining toilet flushing and landscaping. These reductions in household water consumption are expected to alleviate the pressure on municipal wastewater treatment plants by delaying their expansion and facilitating the implementation of a smaller diameter pipeline. Another potential effect is a higher concentration of organic matter in the wastewater, which may lead to a shift in wastewater treatment towards anaerobic biogas production treatments. Some scholars interpret the implementation of greywater reuse systems in urban buildings as part of a paradigm shift in water management toward parts: a decentralized and more sustainable water management scheme (Maimon et al., 2018).
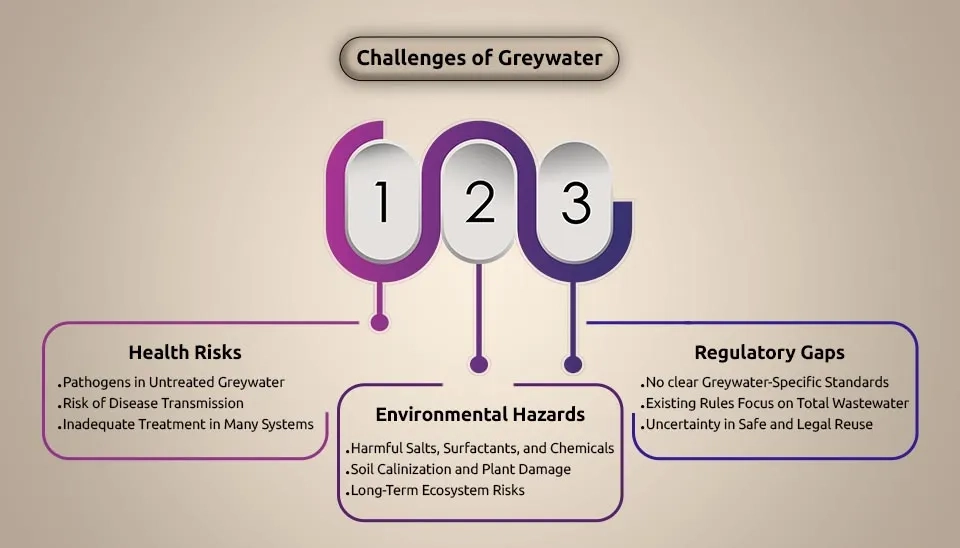
Greywater reuse challenges primarily fall into two categories: health risks and environmental hazards. Health risks mainly from the existence of pathogenic microorganisms and environmental risks mainly from the presence of contaminants such as sodium, surfactants, and micropollutants (Siggins et al., 2016; Benami et al., 2016; Negahban-Azar et al., 2012; Alfiya et al., 2017). Many studies have revealed that regular untreated greywater does not cover most of the developed world's standards for unlimited water reuse. These standards are often based on our knowledge of all household wastewater, which includes the toilet stream, thus making it less suitable for greywater reuse. A remarkable effort to modify specific frameworks for the evaluation of health and environmental risks associated with greywater reuse has been made recently (WHO, 2016; Busgang et al, 2015; O'Toole et al., 2013; Australian Guideline for Recycling 2006).
Microbial risks related to greywater involve the presence of pathogens originating from fecal contamination, mucus, and food preparation, such as Pseudomonas aeruginosa, Staphylococcus aureus, Salmonella spp., and more (Blanky et al., 2015; Benami et al., 2016). Scholars have proposed another minor health concern related to the presence of micro-pollutants and metals in greywater, which might lead to secondary human health risks (Turner et al., 2016; Etchepare et al., 2015). The key tools available to evaluate this risk are Quantitative Microbial Risk Assessments (QMRA) and epidemiological studies, which have recently been conducted for greywater reuse schemes. QMRA is a model-based framework that uses quantitative microbial data and specific exposure scenarios to assess human health risks from pathogens. Since the exposure level is inevitably affected by technological, legislative, and behavioral settings, it is difficult to separate the risk assessment from the reuse-scheme specifications. However, it has been shown that even simple treatments along with basic barriers, like subsurface irrigation and watering crops that aren't eaten raw, are enough to keep the risk at a safe level or allow safe greywater reuse. In addition to the model-based risk assessment, direct epidemiological assessments suggest that greywater reuse does not pose an additional risk. These studies have resulted in the general agreement that treated greywater does not present a significant health threat if the treatment follows established guidelines (Maimon et al., 2018).

Some environmental concerns have been raised regarding greywater reuse. These concerns are related to the potential for pollutants to affect surface or groundwater as well as soil, on the one hand, and the potential effects on plant growth, on the other hand. Although unlikely due to the typically low volumes used on-site, pollutants from greywater, such as nitrogen, boron, and surfactants, may be discharged into surface water or groundwater (Turner et al., 2016; Negahban-Azar et al., 2013). Certain components of greywater, including various micropollutants, have been proven to be toxic, and under specific circumstances, they might have an unfavorable impact on soil and water biota (Deshayes et al., 2017; De gisi et al., 2016).
Since soil is the immediate recipient environment of greywater used for irrigation, it is vital to assess its effects. Some studies have revealed that greywater contaminants might alter soil characteristics. Surfactants, oils, and grease have been suggested to affect soil water repellency. Organic matter and suspended suspended solids (SS) might also physically clog soil pores, and in poorly buffered soils, the soil's pH might increase and interfere with appropriate biochemical processes. Research on the impacts of irrigation using greywater on plants has yielded mixed outcomes. Some scholars found it beneficial, some detrimental, and some found no effect at all. The effect depends on factors such as the properties of greywater, plant species sensitivity, and soil features. In general, greywater is likely to benefit plants due to the nutrients and organic carbon it contains, but it can also harm them because of factors like salinity, high pH, and the toxicity of ingredients such as boron and surfactants. Based on these challenges, it is recommended that raw greywater be treated before reuse (Maimon et al., 2018).
Table. 2. Impacts of greywater on the environment
Item | The negative impact of greywater |
Groundwater | Groundwater contamination |
Soil | ● A lowered soil absorption and water retention capacity; ● Lower alkalinity due to the presence in greywater of sodium, potassium, or calcium salts, especially detergents; a redacted soil dilution absorption and water Retention; washing |
Plant health | The plant harm sign appears |
The domestic utilization of water differs among various countries based on geographical location, infrastructure situation, living standards, customs and habits. As a result, the generation of greywater varies widely. In Africa and the Middle East, the production of greywater ranges between 14 and 161 L/persond. Countries such as Jordan and Mali, which face water scarcity, are on the lower end (between 14 and 59 L/person), while Oman, due to the establishment of several well fields and desalination plants across the country, is on the high end. Greywater generation volumes in Asia, Europe, and the USA are 72–225 L/person, 35–150 L/person and 200 L/person, respectively. Some European communities report low ranges of greywater generation, a result of the water-saving mentality and the presence of eco-villages in countries such as Germany, Norway, Sweden, and Holland (Boyjoo et al., 2013).
The quantity of greywater generated differs based on culture, age, income level, country, household occupancy, gender, water availability, source of water (outside or in-house), and socioeconomic status, among other factors.
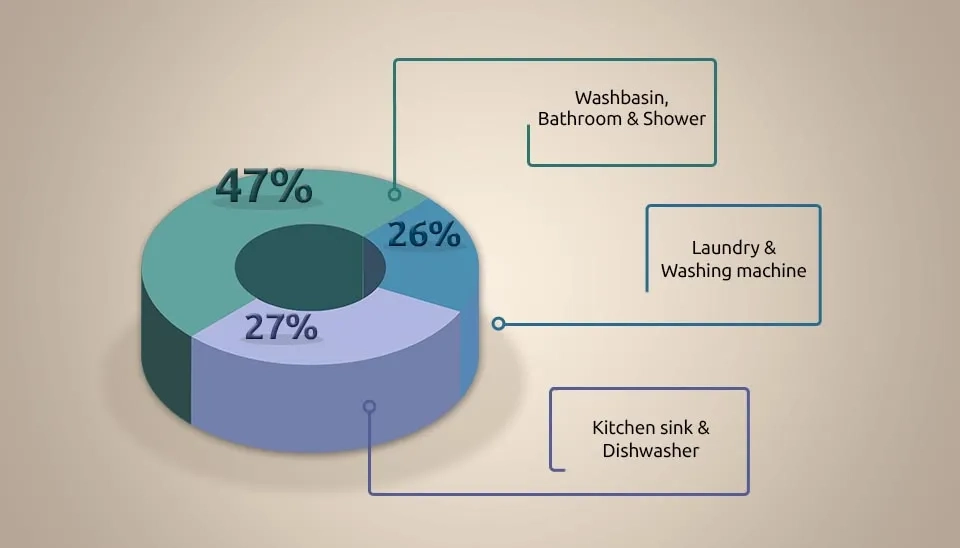
The volume of produced greywater depends on the habits of people living in the household. Up to 75–80% of wastewater is greywater, rising to over 90% in the case of vacuum toilet installations. In countries with high incomes, where water consumption per person is higher, the ratio of greywater to wastewater is lower compared to countries with lower total water consumption. This holds true even if high-consuming countries produce large volumes of greywater. For example, in North America, 52% of greywater to wastewater corresponds to 117 L/PE/day, while in Yemen, 87% of greywater to wastewater corresponds to 35 L/PE/day. These differences arise from the fact that toilet flushing accounts for a large fraction of wastewater in high-income countries, whereas in low-income countries, the prevalence of household toilets is limited (Boano et al., 2019). Household sources contribute variably to greywater composition. On average, three main different sources contribute to the composition of greywater: 47% from bathtubs, basins, and showers; 27% from kitchen sinks and dishwashers; and 26% from laundry sinks and washing machines (Fig. 2). These values were calculated based on twenty studies referring to sixteen countries (Ghaitidak et al., 2013).
Greywater's composition varies widely among households depending on their food habits and standard of living. The constituents of greywater depend on its origin (i.e., bathroom, laundry, or kitchen greywater) (see Table 3). It contains a mixture of acidic and alkaline substances, fats, detergents, toxins, oils and greases, suspended and dissolved liquids, synthetic chemicals, and pathogens. According to research, the organic fraction in greywater accounts for roughly 30%, while nutrients make up 9–20 percent (Al-Husseini et al., 2021). Kitchen wastewater is typically rich in Total Suspended Solids (TSS), oil, grease, and Biochemical Oxygen Demand (BOD), whereas laundry and bathing water contains more Chemical Oxygen Demand (COD), xenobiotic compounds, and phosphorus (mainly inorganic). In contrast, as toilet flushing water and urine are directed to the blackwater stream, the nutrient content in greywater is relatively lower (Ajit,2016).
Table. 3. Grey water sources and their composition
Greywater Source | Constituents |
Kitchen | Dishwashing detergents, oils, fats, foods, hot water, raw meat washing, fruit and vegetable peels, tea or coffee, traces of food preservatives, sand and clay particles |
Bathroom | Shampoo, soap, toothpaste, lint, traces of urine body care products, hair skin, hair oil, body fats, hot water and sand/clay particles |
Hand Basin | Toothpaste, soaps, body care products, shaving waste hairs and skin cells |
Laundry | Chemicals from detergents, oils, solvents, bleaches, paints, hot water, non-biodegradable fibers from clothing |
Researchers reported COD amounts of greywater changing in a range between 254 and 618 mg/L. In contrast, stating that greywater usually contains fewer solids, as their pollutants are dissolved, keeping the COD/BOD ratio around 4/1 in greywater (Drechsel et al. 2015). Differences in COD were observed too, where in Brazil COD values for commercial washing greywater were recorded at 4800 mg/L (Dalahmeh., 2011)(Al-Husseini et al., 2021).
Biological Oxygen Demand (BOD) refers to the oxygen requirement in the greywater for microbial breakdown of organic compounds at a constant temperature. The BOD in greywater hasan expansive variation range (5 to 431 mg/L). The main contributors to BOD in greywater are dissolved organics and suspended food particles (Al-Husseini et al., 2021).
Greywater pH highly depends on the water supply's pH and alkalinity. The pH of greywater is directly related to some chemicals, such as fabric cleaners, bleaches, and disinfectants. In general, there is a large variation in pH, ranging from 6.4 to 8.1 in greywater. Some researchers assigned an acidic pH (5.6) to greywater (Dalahmeh, 2011), while some other researchers reported an alkaline pH of (10) for greywater (Al-Husseini et al., 2021).
Pathogens are regular in greywater. Coliform clusters from 3x10³ to 2.4x10⁷ CFUs per 100 mL were reported by (Christova-Boal et al., 1996). Rose et al. reported there are more coliforms in the wastewater of families with children (3.2 x 10⁵ and 1.5 x 10³ CFUs per 100 ml) compared to families without children (6 x 10⁵ and 80 x 103 units). (Formation per 100 ml) (Rose et al., 1991). Birr et al. in a study conducted in London, expressed that in at least 70% of tested greywater, there were fecal enterococci found (Eriksson et al., 2009). Intestinal pathogenic bacteria, such as salmonella and campylobacter, and materials derived from feces can be introduced by handling food in the kitchen (Friedler et al., 2006). Other pathogenic bacteria such as dermatophytes (Pseudomonas aeruginosa), respiratory pathogens (Legionella pneumophila), and intestinal pathogens (Escherichia coli) have also been reported in greywater (Friedler et al.,2010; Al-Husseini et al., 2021).

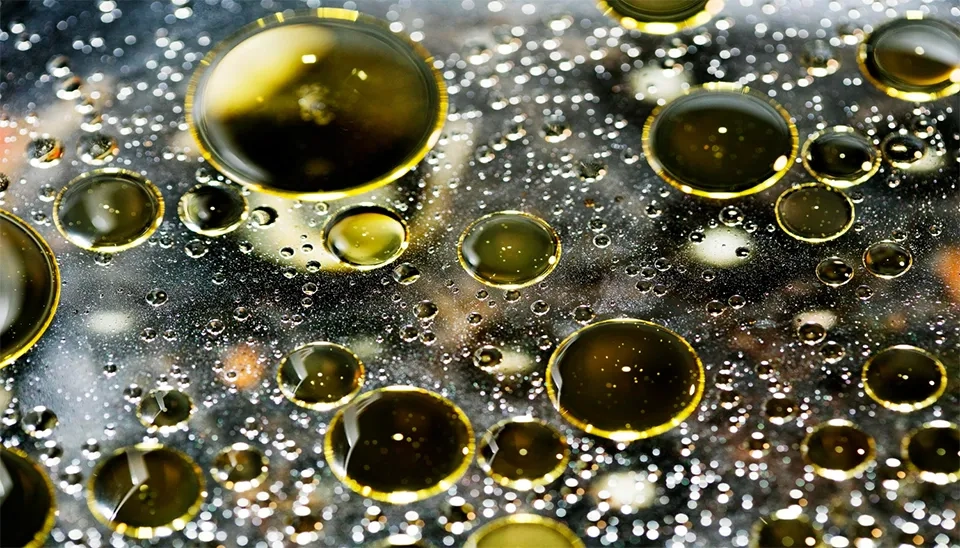
The presence of oil and grease results in an oily layer on the water surface that reduces oxygen diffusion and light, obstructs the filter units and hinders processing efficiency. Reports indicate that the concentration of oil and grease in untreated household wastewater ranges from 50 to 100 mg/L. Oil and grease are critical indices in greywater, and kitchen sinks and bathroom showers are the main sources of this pollutant. Some regular conventional methods for treating oily wastewater are chemical treatment, biological flotation, gravity flotation methods, Dissolved Air Flotation (DAF), and membrane use (Ghunmi et al., 2011). Studied the efficacy of gravity separation and DAF for eliminating oil and grease from domestic wastewater, and 85% removal efficiency was obtained (Al-Husseini et al., 2021).
Conductivity values range from 0.52 to 1.27 dm3 in greywater reported by researchers (Gulyas, 1990). The differences were because kitchen washing and floor washing occurred at different times. Components like phosphate, sodium, and potassium are in the raw materials of detergents, which results in the enrichment of the dissolved solids in the detergent, which consequently increases the electrical conductivity. Researchers also recorded 14 to 3000 μs / cm as ranges of electrical conductivity in greywater (Al-Husseini et al., 2021).
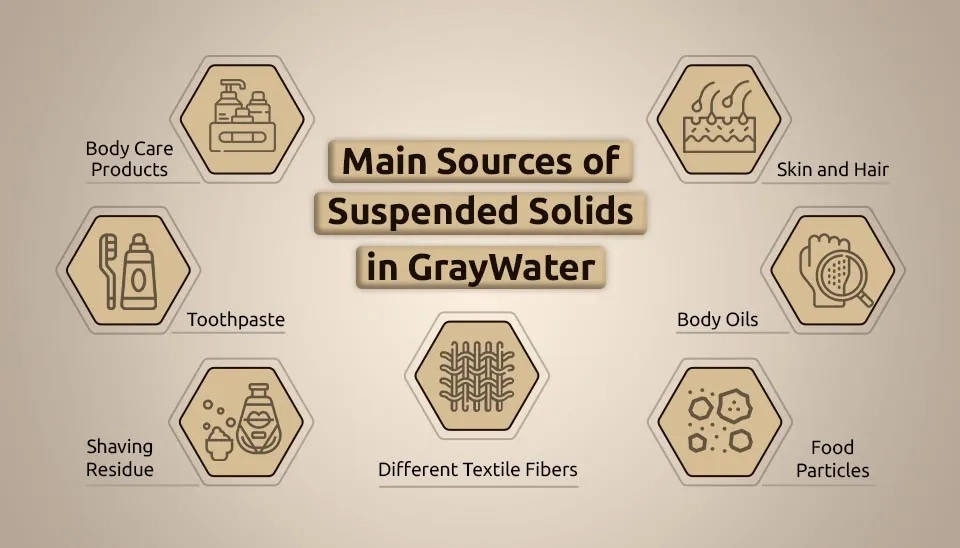
Total Suspended Solids (TSS) values range from 15 to 800 mg/L, while Total Dissolved Solids (TDS) levels differ from 712 to 990 mg/L in greywater. The main sources of suspended solids are in body care products, toothpaste, shaving residues, skin and hair, body fats, food particles, and fibers from various textiles. The amount of suspended solids in greywater is generally low, indicating that a large share of solid pollutants in the greywater are dissolved (Jamrah et al., 2011; Al-Husseini et al., 2021).
The temperature of greywater, based on research, changes within the range of 18–38 °C. The rather high temperature is because of the utilization of warm water for personal hygiene. This relatively high temperature may result in problems since it is an appropriate temperature for microbiological growth. The increased temperatures may also lead to CaCO3 precipitation since CaCO₃ and some other inorganic salts are less soluble at elevated temperatures (Eriksson et al., 2002).

The measured values for turbidity in laundry water have a wide range during the laundry cycle. The turbidity values of the wash cycle were notably higher than the rinse cycle, 39–296 and 14–29 NTU, respectively (Eriksson et al., 2002). Christova-Boal et al. (1996) noted that a family with extensive outdoor activities had the highest turbidity value during the wash cycle (Christova-Boal et al., 1996). For the other greywater, the turbidity value was found to be in the range of 15.3–240 NTU. It should be noted that no values for turbidity in greywater from kitchen sinks were reported in the literature (Eriksson et al., 2002).
The amount of metals and other elements largely depends on the concentrations and quality of the water from the waterworks. Laundry-originated greywater was found to contain high sodium levels in comparison with other kinds of greywater. The sodium in the laundry greywater may be generated by the use of sodium as a counterion to several anionic surfactants utilized in powder laundry detergent (Jeppesen et al., 1996) and the use of sodium chloride in ion exchangers. Only relatively low amounts of heavy metals have been reported in the literature. Zinc for example, the laundry greywater held 0.09–0.34 mg/L while the bathroom greywater contained 0.2–6.3 mg/L. The other authors found concentrations in the range < 0.01–1.8 mg/L. One way to explain the high values in bathroom greywater could be some chlorine tablets used for disinfecting that are acidic and may result in the leaching of zinc from the plumbing (Eriksson et al., 2002).
Various methods and technologies have led to the implementation of numerous greywater reuse systems globally. These range from no treatment at all, or very low-tech and inexpensive filters and biofilters, to high-tech, costly membrane technologies. Since onsite greywater reuse is usually operated by a few mostly non-educated people, it must be reliable, and capable of handling large variations in water quality and quantity, and it must treat the greywater to a certain level that is safe for reuse (Maimon et al., 2018). Table 4 presents an overview of the main treatment methods and technologies, along with their advantages and limitations.
Table. 4. Selection of Common Greywater Treatment Systems (Brief Table)
Treatment unit | Advantages |
Physical | |
Screens and large-pore filters | -Low cost and easy to maintain -Effective as a pretreatment unit to prevent clogging |
Filtration and reverse osmosis (RO) | - Efficient on suspended solids and pathogens - Low space required |
Chemical | |
Very effective on suspended solids removal | |
Advanced Oxidation Processes | Efficient on organic matter and pathogens |
Biological/Physical | |
Constructed Wetlands (CW) | -Efficient on removing organic matter -Low operation and maintenance cost |
Rotating Biological Reactor | -Efficient on removing organic suspended solids -Low space required |
Download Full detailed Table of Common Greywater Treatment Systems
Greywater treatment and reuse technologies were reviewed in this article and the different properties of greywater were explained. This great difference in greywater features is mostly because of water use in various household activities to meet human needs. Implementing a greywater treatment and reuse system at the household level will result in a specific option for the house with economic benefits and thus increase households' number to implement treatment options for greywater reuse.
The success of greywater treatment and reuse schemes depends on many factors, such as technical, economic, and institutional capacity, as well as social factors such as public awareness and acceptance. Thus, there is no single answer for different situations. Therefore in various locations, greywater implementation should be modified according to the local conditions. Moreover, it relies on regulations or best-management practices which are very much dependent on the perception of risks and the specific local balance between the perceived water stress and the need to protect public health. This is reflected by the variation among regulations in different countries. A vital index for safe greywater reuse is communication among all stakeholders— engineers, scientists, policy-makers, water-sector professionals, and end users. Technological and regulatory solutions should be constantly modified to the risks and complexity that come with time and accumulated experience.
-Efficient on organic matter, suspended solids and pathogens -Low space required |
Disinfection |
Chlorination | -Efficient on pathogen removal -Low cost -Easy to store and operate |
UV | -Easy to maintain -No need to store chemicals |
-Efficient on pathogens and viruses -No added chemicals -No pH sensitivity |
Hydrogen peroxide plus | - Efficient on pathogens and viruses - No harmful by-products |
Quick answers to common questions.

Comments
No comments yet
Be the first to comment
Share your thoughts and start the conversation.